Point-and-click graphical user interfaces (GUIs) for R allow people to analyze data using the R software, without having to learn how to program in the R language. This is a brief look at how popular each one is. Knowing that a GUI is popular doesn’t mean it will meet your needs, but it does mean that it’s meeting the needs of many others. This may be helpful information when selecting the appropriate GUI for you, if programming is not your primary interest. For detailed information regarding what each GUI can do for you, and how it works, see my series of comparative reviews, which is currently in progress.
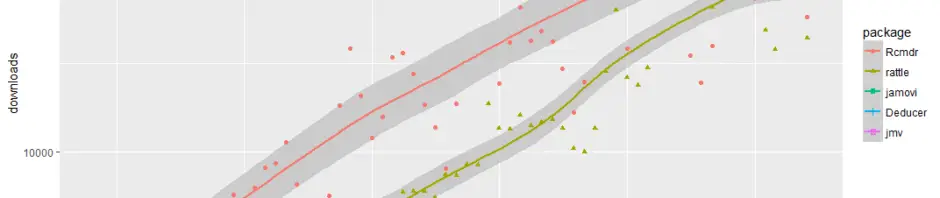
There are many ways to estimate the popularity of data science software, but one of the most accurate is by counting the number of downloads (see appendix for details). Figure 1 shows the monthly downloads of four of the six R GUIs that I’m reviewing (i.e. all that exist as far as I know). We can see that the R Commander (Rcmdr) is the most popular GUI, and it has had steady growth since its introduction. Next comes Rattle, which is more oriented towards machine learning tasks. It too, has shown high popularity and steady growth.
The three lines at the bottom could use more “breathing room” so let’s look at them in their own plot.
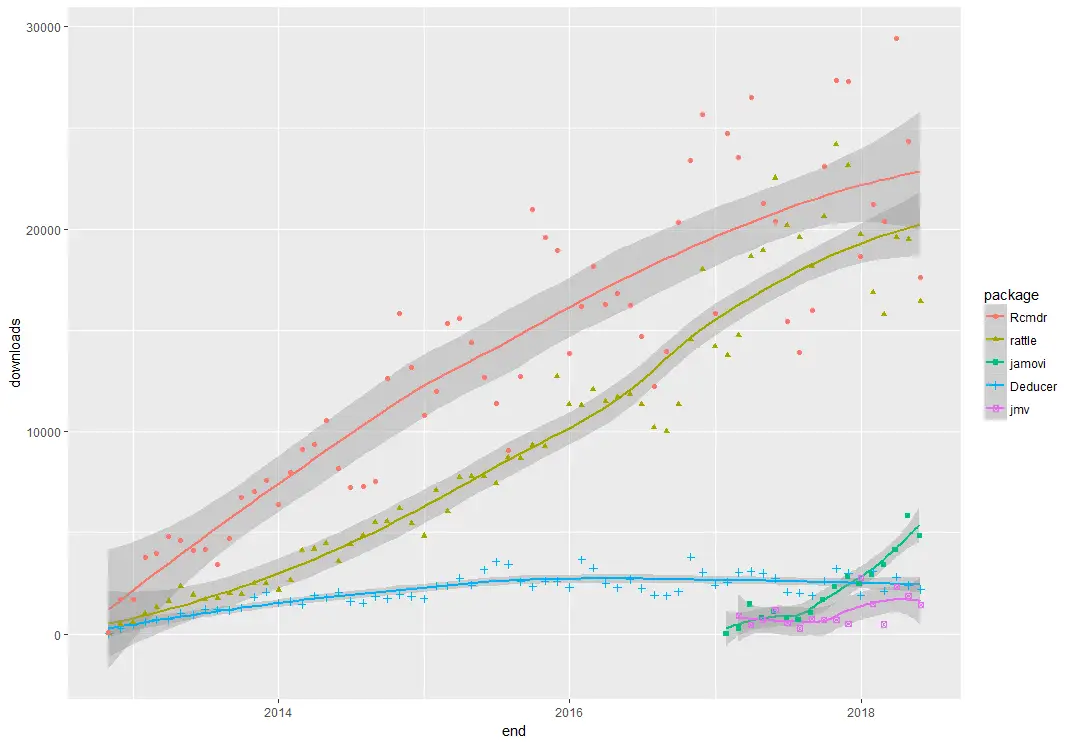
Figure 2 shows the same data as Figure 1, but with the two most popular GUIs removed to make room to study the remaining data. From it we can see that Deducer has been around for many more years than the other two. Downloads for Deducer grew steadily for a couple of years, then they leveled off. Its downloads appear to be declining slightly in recent years. jamovi (its name is not capitalized) has only been around for a brief period, and its growth has been very rapid. As you can see from my recent review, jamovi has many useful features.
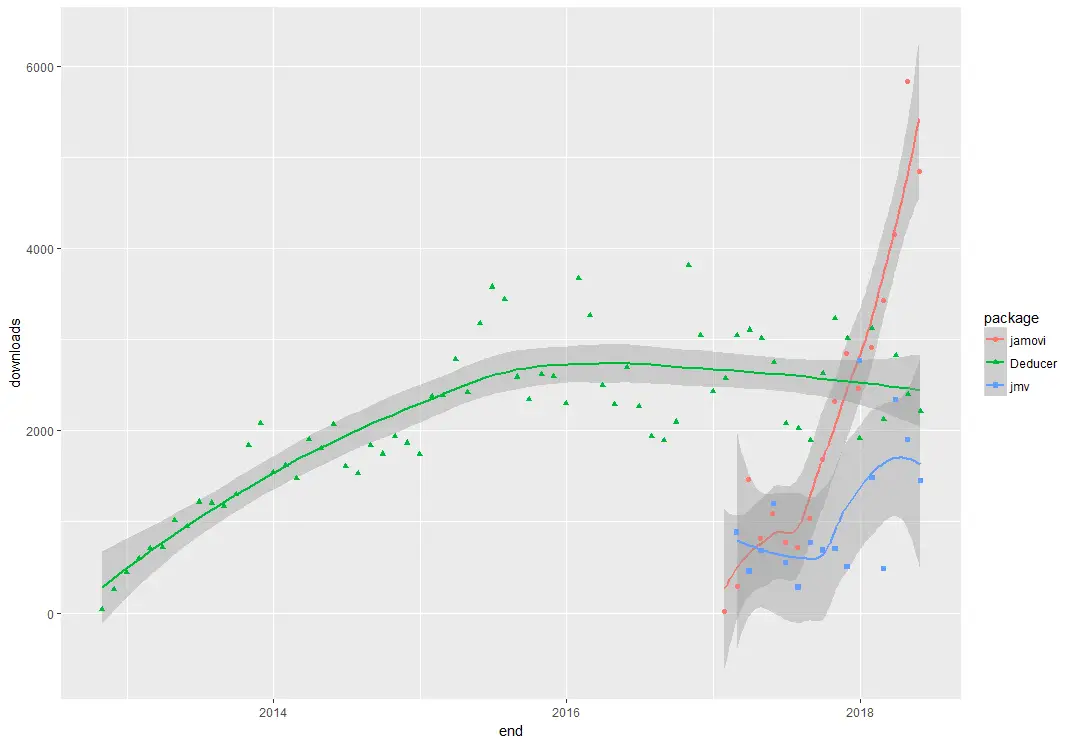
The lowest (blue) line shows downloads for the jmv package, that contains all the functions used by the jamovi GUI. It allows programmers to write code instead of using the jamovi GUI. People who point-and-click their way through an analysis in jamovi can send their code to any R user, who would then use the jmv package to run it. Since most jamovi users would prefer to point-and-click their way through analyses, it makes sense that the jmv package has been downloaded many fewer times than jamovi itself.
Two GUIs are missing from this plot: RKWard and BlueSky Statistics. Neither of those are downloaded from CRAN, and I was unable to obtain data from the developers of those GUIs. However, knowing that RKWard has a similar number of point-and-click features as Deducer, one can deduce (heh!) that it might have a similar level of popularity. The BlueSky software has only recently appeared on the scene, especially with its current level of features, so I expect it too will be towards the bottom, but growing rapidly.
I’m nearly done with all my reviews, so stay tuned to see what the other GUIs offer.
Acknowledgements
Thanks to Guangchuang Yu for making the dlstats package which allowed me to collect data so easily. Thanks also to Jonathon Love, who provided the download data for jamovi, and to Josh Price for his helpful editorial advice.
Appendix: Where the Data Came From
I used R’s dlstats package, which makes quick work of gathering counts of monthly downloads of R packages from the Comprehensive R Archive Network (CRAN). CRAN consists of sites around the world called “mirrors” from which people can download R packages. When starting the download process, R asks you to choose a mirror that is close to your location. In the popular RStudio development environment for R, the default mirror is set to their own server, which is actually a worldwide network of mirrors. Since it’s the default download location in a very popular tool for R, its download data will give us a good idea of the relative popularity of each GUI. The absolute popularity will be greater, but to get that data I would have to gather data from all the other servers around the world. If you have time to do that, please send me the results!
I’m getting ready to teach another round of a data analysis class and I’m considering introducing a GUI component to the usual RStudio/R/RMarkdown. As such, I find your reviews very useful.
Also, are you familiar with Exploratory https://exploratory.io/ ? I came across it recently, downloaded it and opened it. Looked nice on first try, but I haven’t had time to do a serious check. It’s not free in general, but free for education. It’s another one I’m considering using, so if you were able to review it, that would be wonderful 🙂
Hi Andreas,
Thanks for the tip on Exploratory. I’ve been tracking the popularity of data science tools (see: http://r4stats.com/articles/popularity/) for many years. Since this is the first time I’ve heard of Exploratory, I can imagine that they face an extreme challenge in getting noticed. Most of the 50+ packages I do track are free or nearly so for educational use. Many are also free for anyone to use, and students really want to learn software that they can use on the job. My popularity article is due for an update & I’ll look into Exploratory at that time. Full reviews are much harder work so I’ll skip that unless it turns out that Exploratory’s popularity is much higher than I would guess at the moment.
Cheers,
Bob