by Robert A. Muenchen
Introduction
Deducer is a free and open source Graphical User Interface for the R software, one that provides beginners a way to point-and-click their way through analyses. It also integrates into an environment designed to help programmers be more productive. Deducer is available on Windows, Mac, and Linux; there is no server version.
This post one of a series of reviews which aim to help non-programmers choose the Graphical User Interface (GUI) that is best for them. However, the reviews will include a cursory description of the programming support that each GUI offers.
I have joined the BlueSky development team and have written the BlueSky User Guide (online here), but you can trust this series of reviews, as I describe here. All my comments below are easily verifiable. There is no perfect user interface for everyone; each GUI for R has features that appeal to different people.
Terminology
There are various definitions of user interface types, so here’s how I’ll be using the following terms. Reviewing R GUIs keeps me quite busy, so I don’t have time also to review all the IDEs, though my favorite is RStudio.
GUI = Graphical User Interface specifically using menus and dialog boxes to avoid having to type programming code. I do not include any assistance for programming in this definition. So GUI users are people who prefer using a GUI to perform their analyses. They don’t have the time or inclination to become good programmers.
IDE = Integrated Development Environment which helps programmers write code. I do not include point-and-click style menus and dialog boxes when using this term. IDE users are people who prefer to write R code to perform their analyses.
Installation
The various user interfaces available for R differ quite a lot in how they’re installed. Some, such as jamovi, BlueSky, or RKWard, install in a single step. Others, such as the R Commander and Rattle, install in multiple steps. Advanced computer users often don’t appreciate how lost beginners can become while attempting even a simple installation. The HelpDesks at most are flooded with such calls at the beginning of each semester!
Deducer’s installation is quite complex:
- If you haven’t already done so, install the Java JRE. If you’re on Windows, I recommend the Windows x64 64-bit version.
- Download and install R. You should only need to keep the 64-bit version there too.
- Start R as an administrator, and from within it install Deducer and its companion IDE, the Java GUI for R (JGR, pronounced “jaguar”) using:
packages(c(“JGR”,”Deducer”,”DeducerExtras”)) - Start JGR by submitting the commands:
library(“JGR”)
JGR() - Within the JGR Console, start Deducer by choosing “Packages & Data> Package Manager” and clicking the checkboxes labeled “loaded” and “default” in front of both “Deducer” and “Deducer Extras”, then close the box.
- If you wish to get publication-quality output, download and install DeducerRichOutput from here.
- Finally, if you wish to start Deducer by clicking an icon (instead of typing two R commands) download the JGR launcher from here. If you have problems with this working start over while paying particular attention to where the instructions say, “as administrator.”
If your goal is to point-and-click your way through analyses, you probably won’t care for that much complexity. However, if your goal is to learn how to program in R, following those steps will help you on your way. Some of those steps are tasks you must learn when programming R.
Plug-in Modules
When choosing a GUI, one of the most fundamental questions is: what can it do for you? What the initial software installation of each GUI gets you is covered in the Graphics, Analysis, and Modeling sections of this series of articles. Regardless of what comes built-in, it’s good to know how active the development community is. They contribute “plug-ins” which add new menus and dialog boxes to the GUI. This level of activity ranges from very low (e.g. RKWard) through moderate (e.g. jamovi) to very active (e.g. R Commander).
Deducer has been in existence since 2009, and during that time nine plug-ins have been developed. Unfortunately there is no single place to go to find them. On the GUI’s “Packages & Data> GUI Add-ons” menu you’ll find four of them. Others are available here. The complete list of plug-ins that I could find is here:
- DeducerExtras: An add-on package containing a variety of additional analysis dialogs. These include: Distribution quantiles, single/multiple sample proportion tests, paired t-test, Wilcoxon signed rank test, Levene’s test, Bartlett’s test, k-means clustering, Hierarchical clustering, factor analysis, and multi-dimensional scaling
- DeducerPlugInScaling: Reliability and factor analysis
- DeducerMMR: Moderated multiple regression and simple slopes analysis
- DeducerRichOutput: writes results into true word processing tables with fonts and formatting
- DeducerSpatial: A GUI for Spatial Data Analysis and Visualization
- RDSAnalyst: Respondent Driven Sampling
- gMCP: (Experimental) A graphical approach to sequentially rejective multiple test procedures
- RGG: (Experimental) A GUI Generator
- DeducerText: (Experimental) Text Mining
- DeducerHansel: (Experimental) An add-on package which covers many methods common in econometrics, including binary logit, binary probit, and tobit estimates, and various time-series, panel, and spatial data methods. The time-series methods include cointegration analysis.
Startup
Some user interfaces for R, such as jamovi, start by double-clicking on a single icon, which is great for people who prefer to not write code. Others, such as R commander and Rattle, have you start R, then load a package from your library, then call a function. That’s better for people looking to learn R, as those are among the first tasks they’ll have to learn anyway.
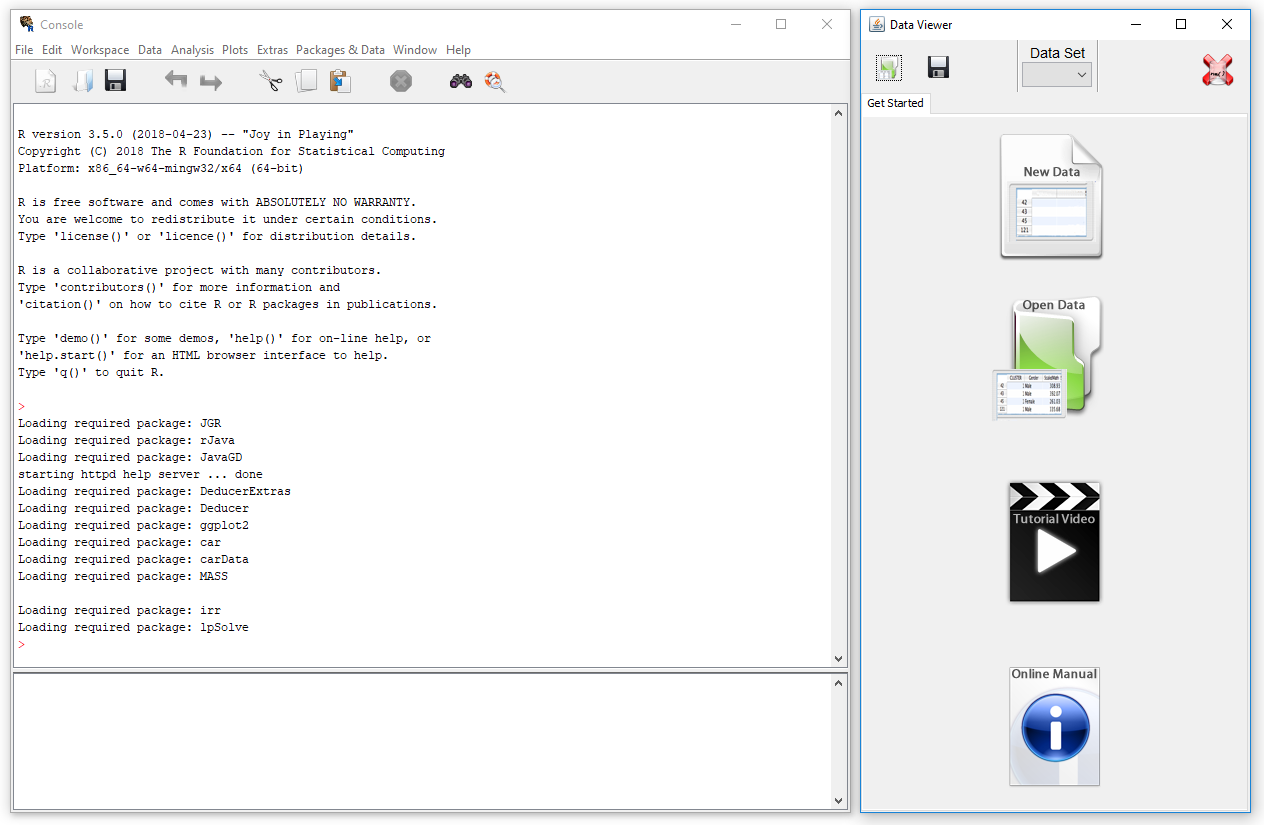
On Deducer’s main web site, it recommends the following steps:
- Start R.
- Load the JGR package from your library by executing the command: “library(“JGR”)”.
- Start JGR by executing the command: “JGR()” and, if you followed the installation instructions above, JGR will start Deducer automatically. Both of the screens shown in Figure 1 will appear.
However, if you make it successfully through all seven installation steps described above, you can also start Deducer by double-clicking on the JGR Launcher icon.
Data Editor / Viewer
A data editor is a fundamental feature in data analysis software. It puts you in touch with your data and lets you get a feel for it, if only in a rough way. A data editor is such a simple concept that you might think there would be hardly any differences in how they work in different GUIs. While there are technical differences, to a beginner what matters the most are the differences in simplicity. Some GUIs, including jamovi, let you create only what R calls a data frame. They use more common terminology and call it a data set: you create one, you save one, later you open one, then you use one. Others, such as RKWard trade this simplicity for the full R language perspective: a data set is stored in a workspace. So the process goes: you create a data set, you save a workspace, you open a workspace, and choose a data set from within it.
Deducer’s data editor is named Data Viewer. That can be confusing since many well-known software packages – including RStudio, the R Commander, and SAS Studio – use the term “viewer” for tools that let you see but not edit the data. The first time I used Deducer, I spent an embarrassing amount of time trying to find the “data editor” when it was right under my nose!
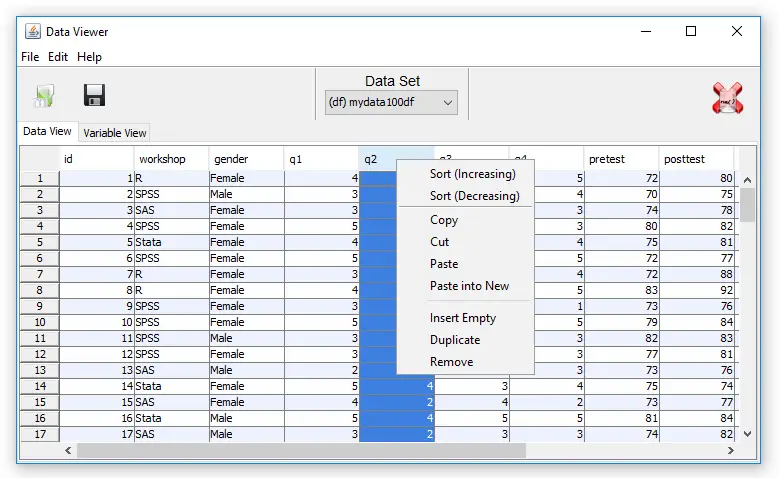
You can start Deducer’s Data Viewer by choosing “File> New Data”. You then provide a name, and click OK. You’ll see it execute a command like, “mydata <- data.frame()” but the Data Viewer may not show you an empty spreadsheet. It tends to lock onto your last data set, but you can choose the drop-down menu labeled “Data Set” to get to the name of the one you just started to create. An empty version of the screen shown in Figure 2 will appear.
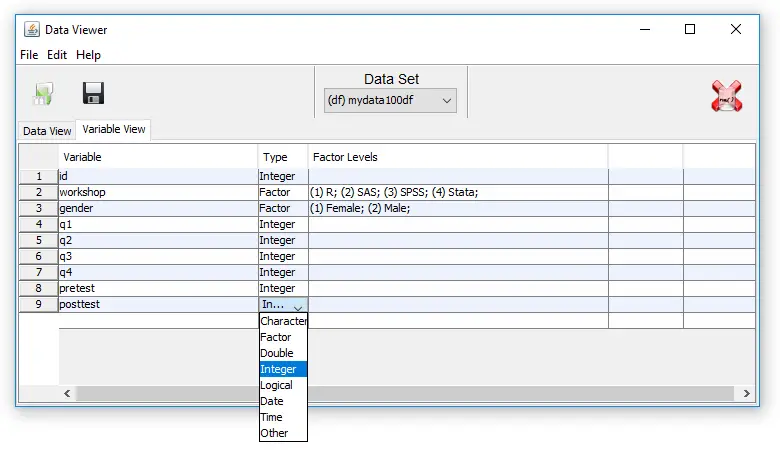
You can start entering data immediately, though the variables will be named V1, V2,… at first. Numeric and character data will be fine, but don’t enter any other type of variables yet, such as dates. Before you go very far, it’s important to click on the “Variable View” tab and fill in your metadata, such as variable names, Type and Factor Level (see Figure 3). When the metadata are filled in, the data editor may wipe out any existing data! For example, if you enter some dates like “8/31/2018” it will be stored as character. If you then switch to the Variable View, and click on Type for that variable, and choose “Date” from the drop-down menu, the editor will delete the exiting dates.
This combination of Data View/Variable View is a common one which was made popular by SPSS. In that software it offers great power by letting you copy metadata from one variable to dozens of others. So you might have survey data where, 1=”Strongly Disagree”, 2=”Disagree”,…”5=”Strongly Agree”. SPSS would allow you to define this for one variable, the copy it and paste it into many others. Deducer’s Variable View does not allow that. You must work one variable at a time, which gets quite tedious.
To open an existing data set, choose “File> Open Data”. If it doesn’t appear in the Data Viewer window, choose it from the Data Set drop-down menu.
Saving the data is done with the standard “File> Save As” menu. You must save each one to its own file. While R allows multiple data sets (and other objects such as models) to be saved to a single file, Deducer does not. Its developers chose to simplify what their users have to learn by limiting each file to a single data set. However, you can also save or load multiple data sets by using JGR’s workspace save and open menu items. This strikes a good balance as beginners will relate to the simplicity of one-data-set-per-file, while advanced users will like the option to deal with more complex multi-object workspaces.
Data Import
Deducer supports many types of data files using the single “File> Open Data” menu. However, it lacks some major file formats as well such as SAS binary files (sas7bdat), Microsoft Access, and SQL database files. Formats Deducer will read include:
- R workspaces (RData)
- R datasets (Rda)
- R objects (Robj)
- Comma Separated Values
- Text files (txt)
- Excel
- SPSS SAV files
- SAS (export only)
- Dbase (dbf)
- Stata
- Systat
- ARFF
- Epiinfo
- Minitab
- S Data Dump
Data Management
It’s often said that 80% of data analysis time is spent preparing the data. Variables need to be transformed, recoded, or created; missing values need to be handled; datasets need to be stacked or merged, aggregated, transposed, or reshaped (e.g. from wide to long and back). A critically important aspect of data management is the ability to transform many variables at once. For example, social scientists need to recode many survey items, biologists need to take the logarithms of many variables. Doing such tasks one variable at a time is tedious. Some GUIs, such as jamovi and RKWard handle only a of these functions. Others, such as the R Commander, can handle many but not all of them.
Deducer offers a fairly sparse set of data management tools. The “Data” menu offers the following set:
- Edit Factor
- Recode Variables
- Transform
- Reset Row Names
- Sort
- Transpose
- Merge Data
- Subset
Its recode ability has pluses and minuses. It has a nice dialog box that helps you to easily recode by values or ranges, and it can apply them to many variables at once. However, unless you’re happy keeping them the same name, you’ll have to rename them one at a time. Other GUIs such as BlueSky will let you assign a prefix like “recoded_” to every variable name greatly speeding the process.
Deducer’s “Transform” dialog box works the same way.
The “Transpose” dialog doesn’t let you select variables, which is problematic since even a single character column will become an entire character row in the output, forcing every variable in the data set to become character. You would have to make a copy of the data and delete the unwanted variables.
Menus & Dialog Boxes
The goal of pointing & clicking your way through an analysis is to save time by recognizing menu settings rather than performing the more difficult task of recalling programming commands. Some GUIs, such as jamovi, make this easy by sticking to menu standards and using simpler dialog boxes; others, such as RKWard, use non-standard menus that are unique to it and hence require more learning.
Deducer uses standard menus where possible. Opening R data sets and importing are both handled by the usual “File> Open> Data”, and that is balanced by “File> Save> Data”. A workspace is an R concept, but Deducer’s use of the “Workspace” menu with standard “Open”, “Save”, and “Save as…” makes it very easy to use.
Output is referred to as “Documents” and they’re also opened and saved from the usual “File” menu.
Documentation & Training
When you start Deducer, it offers you icons that offer to take you to its online manual and training videos on YouTube.com. The default video location focuses on one plug-in for Deducer called RDSA, but clicking on the Videos link at the top of the screen takes to you an extensive set of training videos.
Help
R GUIs provide simple task-by-task dialog boxes which generate much more complex code. So for a particular task, you might want to get help on 1) the dialog box’s settings, 2) the custom functions it uses (if any), and 3) the R functions that the custom functions use. Nearly all R GUIs provide all three levels of help when needed. The notable exception that is the R Commander, which lacks help on the dialog boxes themselves (see that review for details, coming soon).
Deducer’s Help menu offers “R Help” for the generic R help files, and “Deducer Help”, that takes you to the software’s web site’s main help page. Each dialog also includes an “i” icon (for information). That takes you directly to a web site page specific to the task at hand.
Graphics
The various GUIs available for R handle graphics in several ways. Some, such as RKWard, focus on R’s built-in graphics. Others, such as jamovi, use their own functions and integrate them into analysis steps. GUIs also differ quite a lot in how they control the style of the graphs they generate. Ideally, you could set the style once, and then all graphs would follow it. That’s how jamovi works, but then jamovi is limited to its custom graph functions, as nice as they may be. BlueSky offers most of its graphs in standard ggplot2 form, but you can apply many standard “themes” after the plots are created.
Deducer offers a good set of standard plots which use simple dialog boxes and create beautiful plots in the standard, and popular, ggplot2 style. Located under the “Plots> Quick” menu, these include:
- Bar
- Grouped Bar
- Histogram
- Density
- Grouped density
- Simple dotplot
- Grouped dotplot
- Mean
- Line
- Grouped line
- Simple boxplot
- Grouped boxplot
- Scatter
- Scatter smooth
- Histogram 2d
- Bubble
The dialogs for these are quite simple to use. You drag variables into their various roles then click the “Run” button to create the plot. If you would like to embellish the plot, you would instead click the “Builder” button. That creates the plot in Deducer’s powerful Plot Builder window.
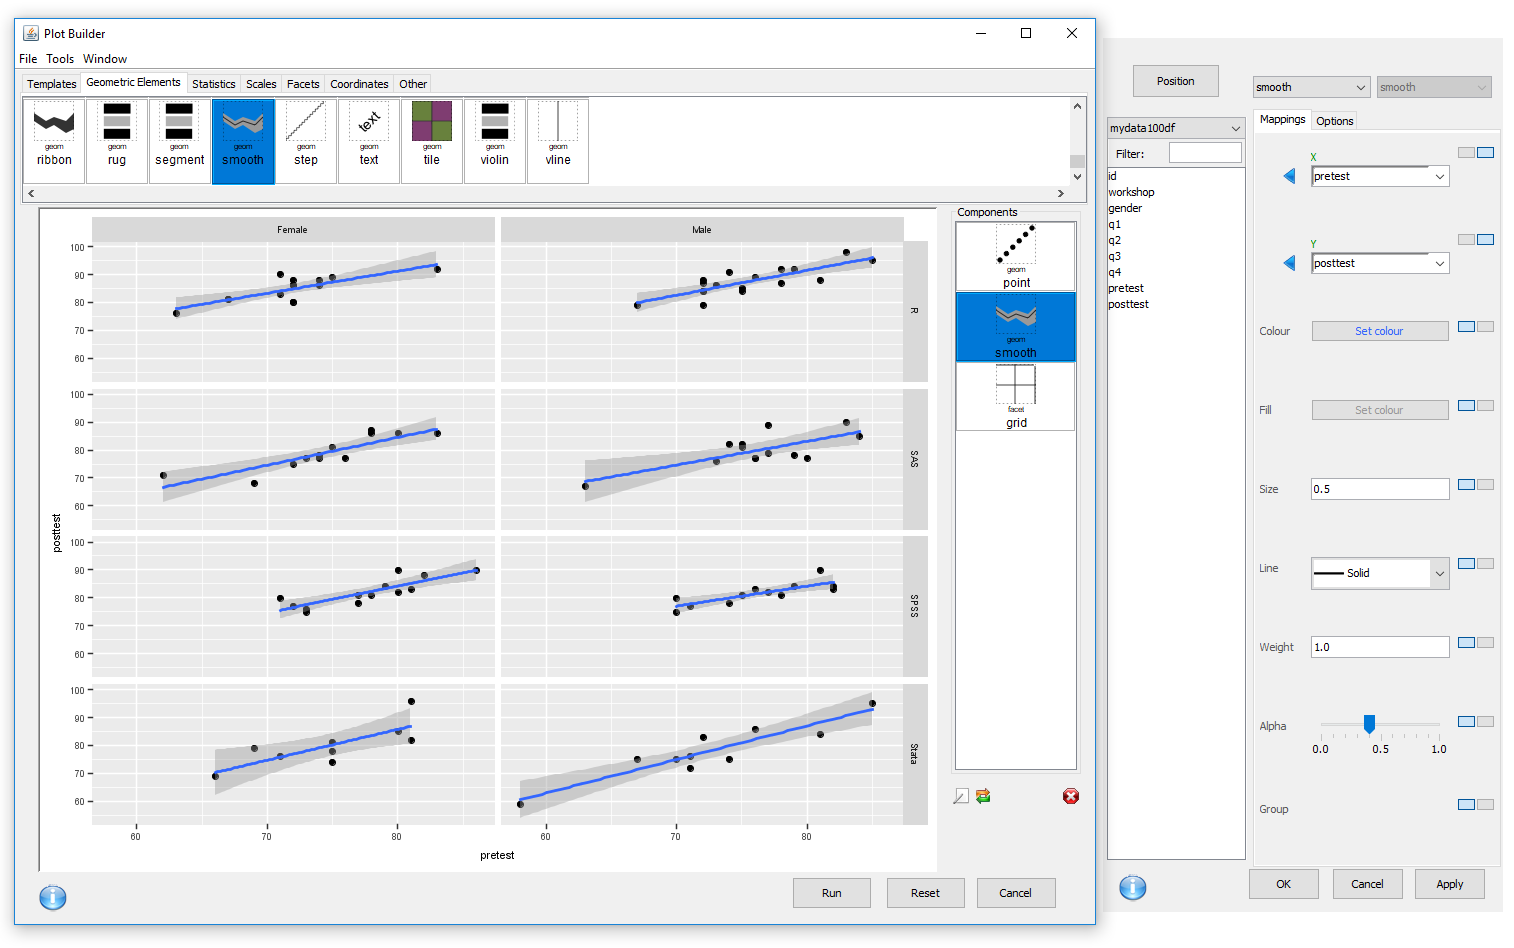
Plot Builder offers control over graphs is uniquely powerful. It is the only GUI to offer the full control over the Grammar of Graphics used in the ggplot2 package. Figure 4 shows its main control panel. Here’s how I created the graph:
- I clicked the “Geometric Elements” tab and choose the “Point” icon among the 36 choices shown, and dragged it onto the plotting area. It prompted me for x- and y-variables among other things. A simple, single scatterplot appeared (not shown).
- On the same tab, I found the “Smooth” icon, dragged it down on top of the plotting area, filled in a dialog box with x- and y-variables, and chose a linear fit. This added a linear fit to the simple, single scatterplot (also not shown).
- Clicked on the “Facets” tab, and dragged the “Grid” icon down on top of the plotting area and filled in the x- and y-variables of Female and Workshop. What had been a single plot split into the six-part plot shown in Figure 4.
While most R code is written to the Console window to see the ggplot2 code it created, but Plot Builder does not write its code the same place as the rest of Deducer’s functions. Instead, you choose “Tools> View call” and it appears in its own window. The code appeared, done almost exactly as I would have written it myself:
ggplot() +
geom_point(aes(x = pretest,y = posttest),data=mydata100df) +
geom_smooth(aes(x = pretest,y = posttest),data=mydata100df,method = lm) +
facet_grid(facets = workshop ~ gender)
I made this graph in my reviews of both BlueSky and R Commander, and it was very quick and easy to do despite never having used those package before. In Plot Builder, it took me much longer despite the fact that I had extensive experience with both Plot Builder and ggplot2. However, if Deducer becomes your main GUI, and you use Plot Builder frequently, you will love it; it’s a GUI masterpiece! Ian Fellows created a two-part video on Plot Builder, which you can watch here and here.
Modeling
The way statistical models (which R stores in “model objects”) are created and used, is an area on which R GUIs differ the most. The simplest, and least flexible approach, is taken by jamovi and RKWard. They try to do everything you might need in a single dialog box. They either don’t save models, or they do nothing with them. To an R programmer, that sounds extreme, since R does a lot with model objects. However, neither SAS nor SPSS were able to save models for their first 35 years of existence, so each approach has its merits.
Deducer goes with the simple approach. Its modeling dialogs are fairly comprehensive, saving you the need (and denying you the ability) to do more with its models. The Model Explorer window that appears when any model is run includes an Export button. That allows you to save models, but you’ll have to use code to do more with them.
Analysis Methods
All of the R GUIs offer a decent set of statistical analysis methods. Some also offer machine learning methods. Since this topic is so complex, I’ll simply list (or link to) the methods each GUI comes with and include links to make it easy to see what plug-ins are available.
All of Deducer’s calculations are done either by native R functions or those of other packages. Sometimes they are called directly, and other times from within Deducer’s own functions. The help files tell you which are being used.
In this series of reviews, I normally don’t list the all the methods found within plug-ins, but the Deducer Extras plug-in contains common analyses that all the other R GUIs include in their main menus, so I include them here. The list of methods that Deducer comes with is:
- Frequencies
- Descriptives
- Contingency Tables
- One Sample Test> One-sample t-test
- One Sample Test> Shapiro-Wilk test against normality
- Two Sample Test> T-test
- Two Sample Test> Permutation
- Two Sample Test> Wilcoxon
- Two Sample Test> Brunner-Munzel
- Two Sample Test> Kolmogorov-Smirnov
- K-Sample Test> One-Way ANOVA (Welch)
- K-Sample Test> One-Way ANOVA
- K-Sample Test> Kruskal-Wallis
- K-Sample Test> Median Test
- Correlation
- Linear Model
- Logistic Model
- Generalized Linear Model [Following are from Deducer Extras plug-in]
- Distribution Quantiles
- Distribution Function Values
- Cumulative Distribution Function
- Load Data From Package – very handy, but an odd location!
- Data Summary
- Single Proportion
- Single Proportion: Exact
- K-Sample Proportion
- Paired Test> Paired t-test
- Paired Test> Wilcoxon Signed Rank Test
- K-Sample Variance Test
- t-test Power
- K-Means Cluster
- Apply K-Means to Data
- Hierarchical Cluster
- Multi-Dimensional Scaling
- Ranking Analysis
Generated R Code
One of the aspects that most differentiates the various GUIs for R is the code they generate. If you decide you want to save code, what type of code is best for you? The base R code as provided by R Commander, which can teach you “classic” R? The concise functions that mimic the simplicity of one-step dialogs such as jamovi provides? The completely transparent (and complex) code provided by RKWard, which might be the best for budding R power users?
Deducer uses a blend of its own functions and built in ones. When using its own functions, the code is quite concise:
frequencies(mydata100df[c("workshop","gender",
"q1","q2","q3","q4")] , r.digits = 1)
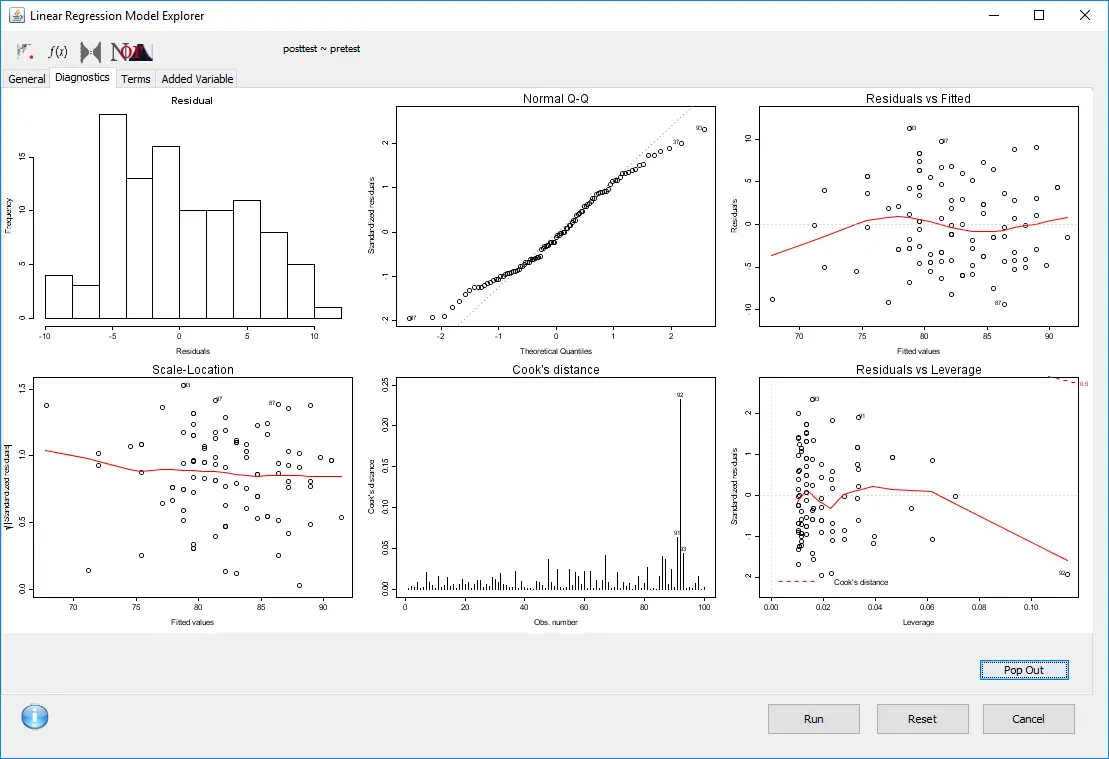
When doing modeling, it uses a blend of fairly standard built-in functions such as this linear regression example:
>.gui.working.env$model.lm <- lm(formula=posttest ~ pretest, data=.gui.working.env$mydata100df,na.action=na.omit)
>Anova(.gui.working.env$model.lm,type='II')
>summarylm(.gui.working.env$model.lm)
It then goes into one of its “Model Explorer” windows as shown in Figure 5. The code for that was something like “plot(.gui.working.env$model.lm)” but it doesn’t show it. Many GUI users won’t care, but those who are trying to learn to program using R code will miss out. The other tabs on that window also show plots related to the current model.
Support for Programmers
Some of the GUIs reviewed in this series of articles include extensive support for programmers. For example, RKWard offers much of the power of Integrated Development Environments (IDEs) such as RStudio or Eclipse StatET. Others, such as jamovi or the R Commander, offer little more than a text editor.
Deducer was designed to work with the JGR IDE. JGR stands for Java GUI for R, but that’s using the term “GUI” to mean menus which support programming; JGR itself includes no menus for creating graphs or running analyses. That’s what Deducer adds to it. JGR offers many of the usual IDE features including syntax highlighting, tool-tips, auto-completion, package installing/managing, and an object browser. A detailed description of JGR’s features is available here. One of the main things missing from JGR support for R Markdown.
Reproducibility & Sharing
One of the biggest challenges that GUI users face is being able to reproduce their work. Reproducibility is useful for re-running everything on the same dataset if you find a data entry error. It’s also useful for applying your work to new datasets so long as they use the same variable names (or the software can handle name changes). Some scientific journals ask researchers to submit their files (usually code and data) along with their written report so that others can check their work.
As important a topic as it is, reproducibility is a problem for GUI users, a problem that has only recently been solved by some software developers. Most GUIs (e.g. the R Commander, Rattle) save only code, but it’s not code that the GUI users wrote, so they also can’t read it or change it! Others such as jamovi, RKWard, and the newest version of SPSS save the dialog box entries and allow GUI users to have reproducibility in the form they prefer.
Deducer offers only code-based reproducibility. There’s no way to get back to a filled-in dialog box when starting from the saved code.
If you wish to share your work with a colleague, you would send them your code and your data set. They could run it one of two ways. If they wanted to use JGR and Deducer, they could install both, then open your code and run it. Using that approach, they would see the rich output tables complete with fonts and formatting. Alternately, they could use any R interface or IDE such as RStudio, in which case they would need install and load only the Deducer package to be able to run your code. Output from that would be in fairly nice looking tables, but they would be monospaced text, not true word processing tables.
Output & Report Writing
Ideally, output should be clearly labeled, well organized, and of publication quality. It might also delve into the realm of word processing through Sweave/knitr and Rmarkdown documents. At the moment, none of the GUIs covered in this series of reviews meets all of these requirements. See the separate reviews to see how each of the other packages is doing on this topic.
The labels for each of Deducer’s analyses are provided by its menu title, e.g. Linear Model Summary. However, you cannot change them to be more descriptive.
The organization of the output is in time-order only, and you cannot even delete any of the steps you take. This often results in a messy output file filled with unneeded results. Tables of contents are commonly used in GUIs to let you re-order, rename, or delete bits of output, but none of that is possible here. You’re better off keeping a word processing file open to paste in the results that you want to keep.
Deducer’s output quality is very high if the DeducerRichOutput plug-in is installed, with nice fonts of your choosing and true rich text tables. That means you can select any table and use CTRL-C to copy it to your word processor (right-clicking will not reveal the usual menu offering a “copy” choice.) That really helps speed your work as standard R output defaults to mono-spaced fonts that require additional steps to get into publication form (e.g. using functions from packages such as xtable or texreg).
Figure 6 shows how Deducer’s output looks without rich text. It’s much easier to read than R’s standard output.
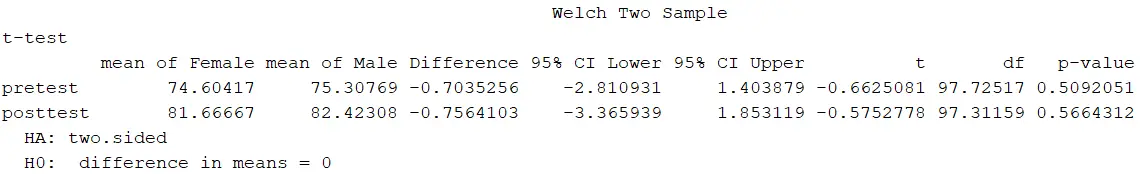
After installing DeducerRichOutput, the same dialog box (or code) will create a full word processing table like the one immediately below. With just a bit of editing, that could quickly be put into any style you like.
| mean of Female | mean of Male | Difference | 95% CI Lower | 95% CI Upper | t | df | p-value | |
| pretest | 74.60 | 75.31 | -0.704 | -2.81 | 1.40 | -0.663 | 97.73 | 0.509 |
| posttest | 81.67 | 82.42 | -0.756 | -3.37 | 1.85 | -0.575 | 97.31 | 0.566 |
Notes:
HA: two.sided
H0: difference in means=0
Group-By Analyses
Repeating an analysis on different groups of observations is a core task in data science. Software needs to provide an ability to select a subset one group to analyze, then another subset to compare it to. All the R GUIs reviewed in this series can do this task. Deducer does single group selections in “Data> Subset”. It generates a subset that you can analyze in the same way as the entire dataset.
Software also needs the ability to automate such selections so that you might generate dozens of analyses, one group at a time. While this has been available in commercial GUIs for decades, only one R GUI in this review series, BlueSky, includes this feature.
Output Management
Early in the development of statistical software, developers tried to guess what output would be important to save to a new dataset (e.g. predicted values, factor scores), and the ability to save such output was built into the analysis procedures themselves. However, researchers were far more creative than the developers anticipated. To better meet their needs, output management systems were created and tacked on to existing tools (e.g. SAS’ Output Delivery System, SPSS’ Output Management System). One of R’s greatest strengths is that every bit of output can be readily used as input. However, for the simplification that GUIs provide, that’s a challenge.
Output data can be observation-level, such as predicted values for each observation or case. When group-by analyses are run, the output data can also be observation-level, but now the (e.g.) predicted values would be created by individual models for each group, rather than one model based on the entire original data set (perhaps with group as a set of indicator variables).
Group-by analyses can also create model-level data sets, such as one R-squared value for each group’s model. They can also create parameter-level data sets, such as the p-value for each regression parameter for each group’s model. (Saving and using single models is covered under “Modeling” above.)
For example, in our organization, we have 250 departments and want to see if any of them have a gender bias on salary. We write all 250 regression models to a data set, and then search to find those whose gender parameter is significant (hoping to find none, of course!)
Of the GUIs reviewed in this series, only BlueSky was able to handle all these types of output management tasks. Deducer’s ability to manage output is minimal. You can save only observation-level output, such as predicted values, residuals, model diagnostics, principal components or factor scores for reuse. This ability is controlled through the Model Explorer’s Export button.
Developer Issues
R package developers can add menus and dialog boxes to their packages by following the directions here.
Conclusion
Deducer offers a fairly comprehensive set of tools that are easy for a point-and-click user to use. Its Plot Builder offers detailed control over the creation of graphics that is unmatched by any other GUI, free or commercial. Deducer’s popularity has leveled off in recent years while the use of other R GUIs has continue to grow. I suspect that’s due to Deducer’s challenging installation process.
Deducer is visually and functionally similar to jamovi. Jamovi lacks the programming support that JGR adds to Deducer and it lacks Plot Builder. However, jamovi’s installation is extremely easy to use and its growth has been very rapid.
BlueSky and the R Commander are way out front of the competition when it comes to breadth of coverage in both data management and methods of analysis. For people looking to learn R programming, they both provide more standard code, albeit in very different styles.
For a summary of all my R GUI software reviews, see the article, R Graphical User Interface Comparison.
Acknowledgements
Thanks to Ian Fellows and the plug-in developers for creating Deducer and making it free and open source. Thanks to Josh Price and Ruben Ortiz for their editorial improvements.