Using Discussion Forum Activity to Estimate Analytics Software Market Share

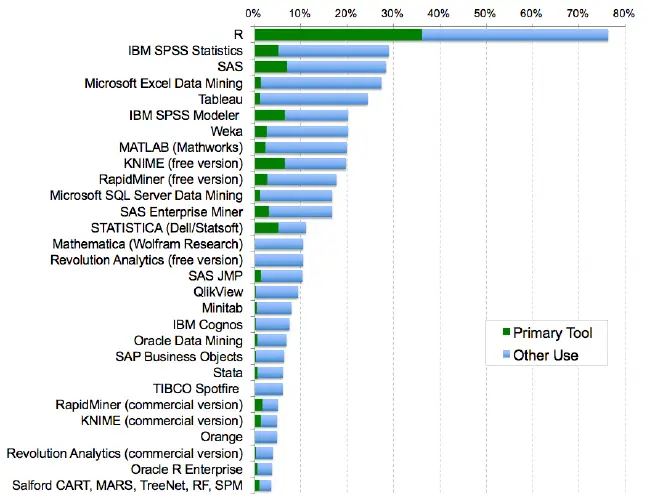
I’m finally getting around to overhauling the Discussion Forum Activity section of The Popularity of Data Analysis Software. To save you the trouble of reading all 43 pages, I’m posting just this section below.

Discussion Forum Activity

Another way to measure software popularity is to see how many people are helping one another use each package or language. While such data is readily available, it too has its problems. Menu-driven software like SPSS or workflow-driven software such as KNIME are quite easy to use and tend to generate fewer questions. Software controlled by programming requires the memorization of many commands and requiring more support. Even within languages, some are harder to use than others, generating more questions (see Why R is Hard to Learn).

Another problem with this type of data is that there are many places to ask questions and each has its own focus. Some are interested in a classical statistics perspective while others have a broad view of software as general-purpose programming languages. In recent years, companies have set up support sites within their main corporate web site, further splintering the places you can go to get help. Usage data for such sites is not readily available.

Another problem is that it’s not as easy to use logic to focus in on specific types of questions as it was with the data from job advertisements and scholarly articles discussed earlier. It’s also not easy to get the data across time to allow us to study trends.  Finally, the things such sites measure include: software group members (a.k.a. followers), individual topics (a.k.a. questions or threads), and total comments across all topics (a.k.a. total posts). This makes combining counts across sites problematic.

Two of the biggest sites used to discuss software are LinkedIn and Quora. They both display the number of people who follow each software topic, so combining their figures makes sense. However, since the sites lack any focus on analytics, I have not collected their data on general purpose languages like Java, MATLAB, Python or variants of C. The results of data collected on 10/17/2015 are shown here:

LinkedIn_Quora_2015

We see that R is the dominant software and that moving down through SAS, SPSS, and Stata results in a loss of roughly half the number of people in each step. Lavastorm follows Stata, but I find it odd that there was absolutely zero discussion of Lavastorm on Quora. The last bar that you can even see on this plot is the 62 people who follow Minitab. All the ones below that have tiny audiences of fewer than 10.

Next let’s examine two sites that focus only on statistical questions: Talk Stats and Cross Validated. They both report the number of questions (a.k.a. threads) for a given piece of software, allowing me to total their counts:

CrossValidated_TalkStats_2015

We see that R has a 4-to-1 lead over the next most popular package, SPSS. Stata comes in at 3rd place, followed by SAS. The fact that SAS is in fourth place here may be due to the fact that it is strong in data management and report writing, which are not the types of questions that these two sites focus on. Although MATLAB and Python are general purpose languages, I include them here because the questions on this site are within the realm of analytics. Note that I collected data on as many packages as were shown in the previous graph, but those not shown have a count of zero. Julia appears to have a count of zero due to the scale of the graph, but it actually had 5 questions on Cross Validated.

If you found this interesting, you can read about the results of other surveys and several other ways to measure software popularity here.

Is your organization still learning R?  I’d be happy to stop by and help. I also have a workshop, R for SAS, SPSS and Stata Users, on DataCamp.com. If you found this post useful, I invite you to follow me on Twitter.

Rexer Analytics Survey Results

Rexer Analytics has released preliminary results showing the usage of various data science tools. I’ve added the results to my continuously-updated article, The Popularity of Data Analysis Software. For your convenience, the new section is repeated below.

Surveys of Use

One way to estimate the relative popularity of data analysis software is though a survey. Rexer Analytics conducts such a survey every other year, asking a wide range of questions regarding data science (previously referred to as data mining by the survey itself.) Figure 6a shows the tools that the 1,220 respondents reported using in 2015.

Figure 6a. Analytics tools used.
Figure 6a. Analytics tools used by respondents to the Rexer Analytics Survey. In this view, each respondent was free to check multiple tools.

We see that R has a more than 2-to-1 lead over the next most popular packages, SPSS Statistics and SAS. Microsoft’s Excel Data Mining software is slightly less popular, but note that it is rarely used as the primary tool. Tableau comes next, also rarely used as the primary tool. That’s to be expected as Tableau is principally a visualization tool with minimal capabilities for advanced analytics.

The next batch of software appears at first to be all in the 15% to 20% range, but KNIME and RapidMiner are listed both in their free versions and, much further down, in their commercial versions. These data come from a “check all that apply” type of question, so if we add the two amounts, we may be over counting. However, the survey also asked,  “What one (my emphasis) data mining / analytic software package did you use most frequently in the past year?”  Using these data, I combined the free and commercial versions and plotted the top 10 packages again in figure 6b. Since other software combinations are likely, e.g. SAS and Enterprise Miner; SPSS Statistics and SPSS Modeler; etc. I combined a few others as well.

Figure 6b. The percent of survey respondents who checked each package as their primary tool.
Figure 6b. The percent of survey respondents who checked each package as their primary tool. Note that free and commercial versions of KNIME and RapidMiner are combined. Multiple tools from the same company are also combined. Only the top 10 are shown.

In this view we see R even more dominant, with over a 3-to-1 advantage compared to the software from IBM SPSS and SAS Institute. However, the overall ranking of the top three didn’t change. KNIME however rises from 9th place to 4th. RapidMiner rises as well, from 10th place to 6th. KNIME has roughly a 2-to-1 lead over RapidMiner, even though these two packages have similar capabilities and both use a workflow user interface. This may be due to RapidMiner’s move to a more commercially oriented licensing approach. For free, you can still get an older version of RapidMiner or a version of the latest release that is quite limited in the types of data files it can read. Even the academic license for RapidMiner is constrained by the fact that the company views “funded activity” (e.g. research done on government grants) the same as commercial work. The KNIME license is much more generous as the company makes its money from add-ons that increase productivity, collaboration and performance, rather than limiting analytic features or access to popular data formats.

If you found this interesting, you can read about the results of other surveys and several other ways to measure software popularity here.

Is your organization still learning R?  I’d be happy to stop by and help. I also have a workshop, R for SAS, SPSS and Stata Users, on DataCamp.com. If you found this post useful, I invite you to follow me on Twitter.

Estimating Analytics Software Market Share by Counting Books

Below is the latest update to The Popularity of Data Analysis Software.

Books

The number of books published on each software package or language reflects its relative popularity. Amazon.com offers an advanced search method which works well for all the software except R and the general-purpose languages such as Java, C, and MATLAB. I did not find a way to easily search for books on analytics that used such general purpose languages, so I’ve excluded them in this section.

The Amazon.com advanced search configuration that I used was (using SAS as an example):

Title: SAS -excerpt -chapter -changes -articles 
Subject: Computers & Technology
Condition: New
Format: All formats
Publication Date: After January, 2000

The “title” parameter allowed me to focus the search on books that included the software names in their titles. Other books may use a particular software in their examples, but they’re impossible to search for easily.  SAS has many manuals for sale as individual chapters or excerpts. They contain “chapter” or “excerpt” in their title so I excluded them using the minus sign, e.g. “-excerpt”. SAS also has short “changes and enhancements” booklets that the developers of other packages release only in the form of flyers and/or web pages, so I excluded “changes” as well. Some software listed brief “articles” which I also excluded. I did the search on June 1, 2015, and I excluded excerpts, chapters, changes, and articles from all searches.

“R” is a difficult term to search for since it’s used in book titles to indicate Registered Trademark as in “SAS(R)”. Therefore I verified all the R books manually.

The results are shown in Table 1, where it’s clear that a very small number of analytics software packages dominate the world of book publishing. SAS has a huge lead with 576 titles, followed by SPSS with 339 and R with 240. SAS and SPSS both have many versions of the same book or manual still for sale, so their numbers are both inflated as a result. JMP and Hadoop both had fewer than half of R’s count and then Minitab and Enterprise Miner had fewer then half again as many. Although I obtained counts on all 27 of the domain-specific (i.e. not general-purpose) analytics software packages or languages shown in Figure 2a, I cut the table off at software that had 8 or fewer books to save space.

Software        Number of Books 
SAS                  576
SPSS Statistics      339
R                    240    [Corrected from: 172]
JMP                   97
Hadoop                89
Stata                 62
Minitab               33
Enterprise Miner      32

Table 1. The number of books whose titles contain the name of each software package.

[Correction: Thanks to encouragement from Bernhard Lehnert (see comments below) the count for R has been corrected from 172 to the more accurate 240.]

R #1 by Wide Margin in Latest KDnuggets Poll

The results of the latest KDnuggets Poll on software for Analytics, Big Data and Data Mining are out, and R has moved into the #1 position by a wide margin. I’ve updated the Surveys of Use section of The Popularity of Data Analysis Software to include a subset of those results, which I include here:

…The results of a similar poll done by the KDnuggets.com web site in May of 2015 are shown in Figure 6b. This one shows R in first place with 46.9% of users reporting having used it for a real project. RapidMiner, SQL, and Python follow quite a bit lower with around 30% of users. Then at around 20% are Excel, KNIME and HADOOP. It’s interesting to see what has happened to two very similar tools, RapidMiner and KNIME. Both used to be free and open source. RapidMiner then adopted a commercial model, with an older version still free. KNIME kept its desktop version free and, likely as a result, its use has more than tripled over the last three years. SAS Enterprise Miner uses a very similar workflow interface, and its reported use, while low, has almost doubled over the last three years. Figure 6b only shows those packages that have at least 5% market share. KDnuggets’ original graph and detailed analysis are here.

KDnuggests 2015
Figure 6b. Percent of respondents that used each software in KDnuggets’ 2015 poll. Only software with 5% market share are shown. The % alone is the percent of tool voters that used only that tool alone. For example, only 3.6% of R users have used only R, while 13.7% of RapidMiner users indicated they used that tool alone. Years are color coded, with 2015, 2014, 2013 from top to bottom.

I invite you to follow me here or at http://twitter.com/BobMuenchen. If you’re interested in learning R, DataCamp.com offers my 16-hour interactive workshop, R for SAS, SPSS and Stata Users for $25. That’s a monthly fee, but it definitely won’t take you a month to take it!  For students & academics, it’s $9. I also do R training on-site.

R Now Contains 150 Times as Many Commands as SAS

by Bob Muenchen

In my ongoing quest to analyze the world of analytics, I’ve updated the Growth in Capability section of The Popularity of Data Analysis Software. To save you the trouble of foraging through that tome, I’ve pasted it below.

Growth in Capability

The capability of analytics software has grown significantly over the years. It would be helpful to be able to plot the growth of each software package’s capabilities, but such data are hard to obtain. John Fox (2009) acquired them for R’s main distribution site http://cran.r-project.org/, and I collected the data for later versions following his method.

Figure 9 shows the number of R packages on CRAN for the last version released in each year. The growth curve follows a rapid parabolic arc (quadratic fit with R-squared=.995). The right-most point is for version 3.1.2, the last version released in late 2014.

Fig_9_CRAN
Figure 9. Number of R packages available on its main distribution site for the last version released in each year.

To put this astonishing growth in perspective, let us compare it to the most dominant commercial package, SAS. In version, 9.3, SAS contained around 1,200 commands that are roughly equivalent to R functions (procs, functions etc. in Base, Stat, ETS, HP Forecasting, Graph, IML, Macro, OR, QC). In 2014, R added 1,357 packages, counting only CRAN, or approximately 27,642 functions. During 2014 alone, R added more functions/procs than SAS Institute has written in its entire history.

Of course SAS and R commands solve many of the same problems, they are certainly not perfectly equivalent. Some SAS procedures have many more options to control their output than R functions do, so one SAS procedure may be equivalent to many R functions. On the other hand, R functions can nest inside one another, creating nearly infinite combinations. SAS is now out with version 9.4 and I have not repeated the arduous task of recounting its commands. If SAS Institute would provide the figure, I would include it here. While the comparison is far from perfect, it does provide an interesting perspective on the size and growth rate of R.

As rapid as R’s growth has been, these data represent only the main CRAN repository. R has eight other software repositories, such as Bioconductor, that are not included in
Figure 9. A program run on 5/22/2015 counted 8,954 R packages at all major repositories, 6,663 of which were at CRAN. (I excluded the GitHub repository since it contains duplicates to CRAN that I could not easily remove.) So the growth curve for the software at all repositories would be approximately 34.4% higher on the y-axis than the one shown in Figure 9. Therefore, the estimated total growth in R functions for 2014 was 28,260 * 1.344 or 37981.

As with any analysis software, individuals also maintain their own separate collections typically available on their web sites. However, those are not easily counted.

What’s the total number of R functions? The Rdocumentation site shows the latest counts of both packages and functions on CRAN, Bioconductor and GitHub. They indicate that there is an average of 20.37 functions per package. Since a program run on 5/22/2015 counted 8,954 R packages at all major repositories except GitHub, on that date there were approximately 182,393 total functions in R. In total, R has over 150 times as many commands as SAS.

I invite you to follow me here or at http://twitter.com/BobMuenchen. If you’re interested in learning R, DataCamp.com offers my 16-hour interactive workshop, R for SAS, SPSS and Stata Users for $25. That’s a monthly fee, but it definitely won’t take you a month to take it!  For students & academics, it’s $9. I also do R training on-site.

Stata’s Academic Growth Nearly as Fast as R’s

by Bob Muenchen

Analytics tools take significant effort to master, so once learned people tend to stick with them for much of their careers. This makes the tools used in academia of particular interest in the study of future trends of market share. I’ve been tracking The Popularity of Data Analysis Software regularly since 2010, and thanks to an astute reader, I now have a greatly improved estimate of Stata’s academic growth. Peter Hedström, Director of the Institute for Analytical Sociology at Linköping University, wrote to me convinced that I was underestimating Stata’s role by a wide margin, and he was right.

Fig_2e_ScholarlyImpactBig6

Two things make Stata’s popularity difficult to guage: 1) Stata means “been” in Italian, and 2) it’s a common name for the authors of scholarly papers and those they cite. Peter came up with the simple, but very effective, idea of adding Statacorp’s headquarter, College Station, Texas, to the search. That helped us find far more Stata articles while blocking the irrelevant ones. Here’s the search string we came up with:

("Stata" "College Station") OR "StataCorp" OR "Stata Corp" OR 
"Stata Journal" OR "Stata Press" OR "Stata command" OR 
"Stata module"

The blank between Stata and College Station is an implied logical “and”. This string found 20% more articles than my previous one. This success motivated me to try and improve some of my other search strings. R and SAS are both difficult to search for due to how often those letters stand for other things. I was able to improve my R search string by 15% using this:

"r-project.org" OR "R development core team" OR "lme4" OR 
"bioconductor" OR "RColorBrewer" OR "the R software" OR 
"the R project" OR "ggplot2" OR "Hmisc" OR "rcpp" OR "plyr" OR 
"knitr" OR "RODBC" OR "stringr" OR "mass package"

Despite hours of effort, I was unable to improve on the simple SAS search string of “SAS Institute.” Google Scholar’s logic seems to fall apart since “SAS Institute” OR “SAS procedure” finds fewer articles!  If anyone can figure that out, please let me know in the comments section below. As usual, the steps I use to document all searches are detailed here.

The improved search strings have affected all the graphs in the Scholarly Articles section of The Popularity of Data Analysis Software. At the request of numerous readers, I’ve also added a log-scale plot there which shows the six most popular classic statistics packages:

Fig_2f_ScholarlyImpactAllStat

If you’re interested in learning R, DataCamp.com offers my 16-hour interactive workshop,
R for SAS, SPSS and Stata Users for $25. That’s a monthly fee, but it definitely won’t take you a month to take it!  For students & academics, it’s $9. I also do training on-site but I’m often booked about 8 weeks out.

I invite you to follow me on this blog and on Twitter.

Fastest Growing Software for Scholarly Analytics: Python, R, KNIME…

In my ongoing quest to “analyze the world of analytics”, I’ve added the following section below to The Popularity of Data Analysis Software:

It would be useful to have growth trend graphs for each of the analytics packages I track, but collecting such data is too time consuming since it must be re-collected every year (since search algorithms change). What I’ve done instead is collect data only for the past two complete years, 2013 and 2014. Figure 2e shows the percent change from 2013 to 2014, with the “hot” packages whose use is growing shown in red. Those whose use is declining or “cooling” are shown in blue. Since the number of articles tends to be in the thousands or tens of thousands, I have removed any software that had fewer than 100 articles in 2013. Going from one to five articles may represent 500% growth, but it’s not of much interest.

Figure 2e. Change in the number of scholarly articles using each software in the most recent two complete years (2013 to 2014). Packages shown in red are "hot" and growing, while those shown in blue are "cooling down" or declining.
Figure 2e. Change in the number of scholarly articles using each software in the most recent two complete years (2013 to 2014). Packages shown in red are “hot” and growing, while those shown in blue are “cooling down” or declining.

The three fastest growing packages are all free and open source: Python, R and KNIME. All three saw more than 25% growth. Note that the Python figures are strictly for analytics use as defined here. At the other end of the scale are SPSS and SAS, both of which declined in use by around 25%. Recall that Fig. 2a shows that despite recent years of decline, SPSS is still extremely dominant for scholarly use.

Three of the packages whose use is growing implement the powerful and easy-to-use workflow or flowchart user interface: KNIME, RapidMiner and SPSS Modeler. As useful as that approach is, it’s not sufficient for success as we see with SAS Enterprise Miner, whose use declined nearly 15%.

It will be particularly interesting to see what the future holds for KNIME and RapidMiner. The companies were two of only four chosen by the Gartner Group as having both a complete vision of the future and the ability to execute that vision (Fig. 7a). Until recently, both were free and open source. RapidMiner then started charging for its current version, leaving its older version as the only free one. Recent offers to make it free for academic use don’t include use on projects with grant funding, so I expect KNIME’s higher rate of growth to remain faster than RapidMiner’s. However, in absolute terms, scholarly use of RapidMiner is currently almost twice that of KNIME, as shown in Fig. 2b.

Google Scholar Finds Far More SPSS Articles; Analytics Forecast Updated

Only last August I wrote that among scholars, the use of R had probably exceeded that of SPSS to become their most widely used software for analytics. That forecast was based on Google Scholar searches focused on one year at a time, from 1995 through 2014. Each year from 2010 through 2014, I re-collected that entire data set just in case Google changed the search algorithm enough to affect the overall pattern. The data stayed roughly the same for those four years, but Google Scholar now finds almost twice as many articles for SPSS (at its peak year of 2008) than it found last year and 12% more articles for SAS. Changes in search results for articles that used R varied slightly with fewer in the early years and more in the latter ones. So R did not become the most widely used analytics software among academics in 2014. It’s unlikely to become so for another two years, unless present trends change.

So what happened? We’re looking back across many years, so while it’s possible that SPSS suddenly became much more popular in 2014, that could not account for lifting the whole trend line. It’s possible Google Scholar improved its algorithm to find articles that existed previously. It’s also possible that new journal archives have opened themselves up to being indexed by Google. Why would it affect SPSS more than SAS or R? SPSS is menu-driven so it’s easy to install with its menus and dialog boxes translated into many languages. Since SAS and R are much more frequently used via their English-based languages, they may not be as popular in non-English speaking countries. Therefore, one might see a disproportionate impact on SPSS by new non-English archives becoming available. If you have an alternate hypothesis, please leave it in the comments below.

The remainder of this post is the complete updated section on this topic from The Popularity of Data Analysis Software:

Scholarly Articles

The more popular a software package is, the more likely it will appear in scholarly publications as a topic or as a tool of analysis. The software that is used in scholarly articles is what the next generation of analysts will graduate knowing, so it’s a leading indicator of where things are headed. Google Scholar offers a way to measure such activity. However, no search of this magnitude is perfect and will include some irrelevant articles and reject some relevant ones. The details of the search terms I used are complex enough to move to a companion article, How to Search For Data Science Articles. Since Google regularly improves its search algorithm, each year I re-collect the data for all years.

Figure 2a shows the number of articles found for each software package for the most recent complete year, 2014. SPSS is by far the most dominant package, likely due to its balance between power and ease-of-use. SAS has around half as many, followed by MATLAB and R. The software from Java through Statgraphics show a slow decline in usage from highest to lowest. Note that the general purpose software C, C++, C#, MATLAB, Java and Python are included only when found in combination with analytics terms, so view those as much rougher counts than the rest.

Fig_2a_ScholarlyImpact2014
Figure 2a. The number of scholarly articles that use each software package during the most recent complete year, 2014.

From RapidMiner on down, the counts appear to be zero. That’s not the case, the counts are just very low compared to the more popular packages, used in tens of thousands articles. Figure 2b shows the software only for those packages that have fewer than 825 articles (i.e. the bottom part of Fig. 2a), so we can see how they compare. RapidMiner, KNIME, SPSS Modeler and SAS Enterprise Miner are packages that all use the powerful and easy-to-use workflow interface, but their use has not yet caught on among scholars. BMDP is one of the oldest packages in existence. Its use has been declining for many years, but it’s still hanging in there. The software in the bottom half of this figure contain the newcomers, with the notable exception of Megaputer, whose Polyanalyst software has been around for many years now.

Fig_2b_ScholarlyImpact2014
Figure 2b. The number of scholarly articles for software that was used by fewer than 825 scholarly articles (i.e. the bottom part of Fig. 2a, rescaled.)

I’m particularly interested in the long-term trends of the classic statistics packages. So in Figure 2c I’ve plotted the same scholarly-use data for 1995 through 2014, the last complete year of data when this graph was made. As in Figure 2a, SPSS has a clear lead, but now you can see that its dominance peaked in 2008 and its use is in sharp decline. SAS never came close to SPSS’ level of dominance, and it also peaked around 2008. Note that the decline in the number of articles that used SPSS or SAS is not balanced by the increase in the other software shown. This is likely due to the fact that those two leaders faced increasing competition from many more software packages than can be shown in this type of graph (such as those shown in Figure 2a).

Fig_2a_ScholarlyImpactBig6
Figure 2c. The number of scholarly articles found in each year by Google Scholar. Only the top six “classic” statistics packages are shown.

Since SAS and SPSS dominate the vertical space in Figure 2c by such a wide margin, I removed those two packages and added the next two most popular statistics packages, Systat and JMP, with the result shown in Figure 2d. Freeing up so much space in the plot now allows us to see that the use of R is experiencing very rapid growth and is pulling away from the pack, solidifying its position in third place. If the current trends continue, the use of R may pass that of SPSS and SAS by the end of 2016. Note that current trends have shifted before as discussed here.

Stata has moved into fourth place, crossing above Statistica in 2014. The growth in the use of Stata is more rapid than all the classic statistics packages except for R. The use of Statistica, Minitab, Systat and JMP are next in popularity, respectively, with their growth roughly parallel to one another. [Note that in the plots from previous years, Statistica was displayed as a flat line at the very bottom of the graph. That turned out to be a search-related artifact. Many academics who use Statistica don’t mention the package by software name but rather say something like, “we used the statistics package by Statsoft.”]

Fig_2a_ScholarlyImpactLittle6
Figure 2d. The number of scholarly articles found in each year by Google Scholar for classic statistics packages after market leaders SPSS and SAS have been removed.

I’ll announce future update on Twitter, where you can follow me as @BobMuenchen.


It’s Analytics Survey Time!

Every other year Rexer Analytics surveys Data Analysts, Predictive Modelers, Data Scientists, Data Miners, and all other types of analytic professionals, students, and academics regarding the software they use.  I then update the main results in The Popularity of Data Analysis Software. Here’s where you can take the survey:

Survey Link:  www.rexeranalytics.com/Data-Miner-Survey-2015-Intro.html

Access Code:  R8M4E2  

Survey results will be unveiled at the Fall-2015 Boston Predictive Analytics World event.

Rexer Analytics has been conducting the Data Miner Survey since 2007.  Each survey explores the analytic behaviors, views and preferences of data miners and analytic professionals.  Over 1,200 people from around the globe participated in the 2013 survey.  Summary reports (40 page PDFs) from previous surveys are available FREE to everyone who requests them by emailing DataMinerSurvey@RexerAnalytics.com.  Also, highlights of earlier Data Miner Surveys are available at www.rexeranalytics.com/Data-Miner-Survey-Results-2013.html, including best practices shared by respondents on analytic success measurement, overcoming data mining challenges, and other topics.  The FREE Summary Report for this 2015 Data Miner Survey will be available to everyone Fall-2015.

Please help spread the word.

Rexer Analytics is a consulting firm focused on providing data mining and analytic CRM solutions.  Recent solutions include customer loyalty analyses, customer segmentation, predictive modeling to predict customer attrition and to target direct marketing, fraud detection, sales forecasting, market basket analyses, and complex survey research.  More information is available at www.RexerAnalytics.com or by calling +1 617-233-8185.

SAS is #1…In Plans to Discontinue Use

I’ve been tracking The Popularity of Data Analysis Software for many years now, and a clear trend is the decline of the market share of the bigger analytics firms, notably SAS and SPSS. Many people have interpreted my comments as implying the decline in the revenue of those companies. But the fields involved in analytics (statistics, data mining, analytics, data science, etc.) have been exploding in popularity, so having a smaller slice of a much bigger pie still leaves billions in revenue for the big players.

Each year, the Gartner Group, “the world’s leading information technology research and advisory company”, collects data in a survey of the customers of 42 business intelligence firms. They recently released the data on the customers’ plans to discontinue use of their current software in one to three years. The results are shown in the figure below. Over 16% of the SAS Institute customers surveyed reported considering discontinuing their use of the software, the highest of any of the vendors shown. It will be interesting to see if this will actually lead to an eventual decline in revenue. Although I have helped quite a few organizations migrate from SAS to R, I would be surprised to see SAS Institute’s revenue decline. They offer excellent software and service which I still use, though not anywhere near as much as R.

The full Gartner report is available here.

SAS Attrition Plot