Updated Comparison of R Graphical User Interfaces

I have just updated my detailed reviews of Graphical User Interfaces (GUIs) for R, so let’s compare them again. It’s not too difficult to rank them based on the number of features they offer, so let’s start there. I’m basing the counts on the number of dialog boxes in each category of four categories:

  • Ease of Use
  • General Usability
  • Graphics
  • Analytics

This is trickier data to collect than you might think. Some software has fewer menu choices, depending instead on more detailed dialog boxes. Studying every menu and dialog box is very time-consuming, but that is what I’ve tried to do. I’m putting the details of each measure in the appendix so you can adjust the figures and create your own categories. If you decide to make your own graphs, I’d love to hear from you in the comments below.

Figure 1 shows how the various GUIs compare on the average rank of the four categories. R Commander is abbreviated Rcmdr, and R AnalyticFlow is abbreviated RAF. We see that BlueSky is in the lead with R-Instat close behind. As my detailed reviews of those two point out, they are extremely different pieces of software! Rather than spend more time on this summary plot, let’s examine the four categories separately.

Figure 1. Mean of each R GUI’s ranking of the four categories. To make this plot consistent with the others below, the larger the rank, the better.

For the category of ease-of-use, I’ve defined it mostly by how well each GUI does what GUI users are looking for: avoiding code. They get one point each for being able to install, start, and use the GUI to its maximum effect, including publication-quality output, without knowing anything about the R language itself. Figure two shows the result. JASP comes out on top here, with jamovi and BlueSky right behind.

Figure 2. The number of ease-of-use features that each GUI has.

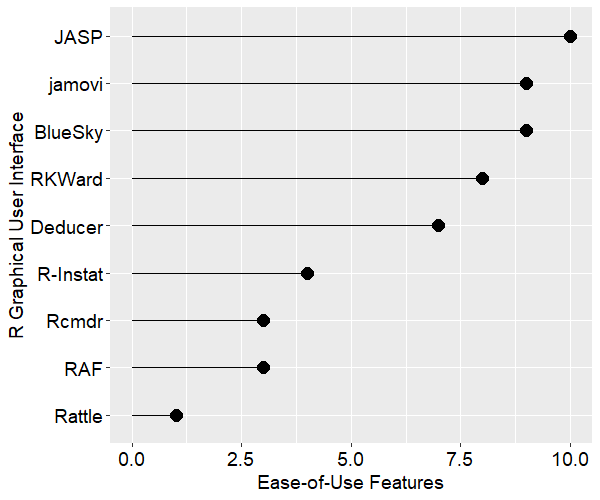
Figure 3 shows the general usability features each GUI offers. This category is dominated by data-wrangling capabilities, where data scientists and statisticians spend most of their time. This category also includes various types of data input and output. BlueSky and R-Instat come out on top not just due to their excellent selection of data wrangling features but also due to their use of the rio package for importing and exporting files. The rio package combines the import/export capabilities of many other packages, and it is easy to use. I expect the other GUIs will eventually adopt it, raising their scores by around 40 points. JASP shows up at the bottom of this plot due to its philosophy of encouraging users to prepare the data elsewhere before importing it into JASP.

Figure 3. Number of general usability features for each GUI.

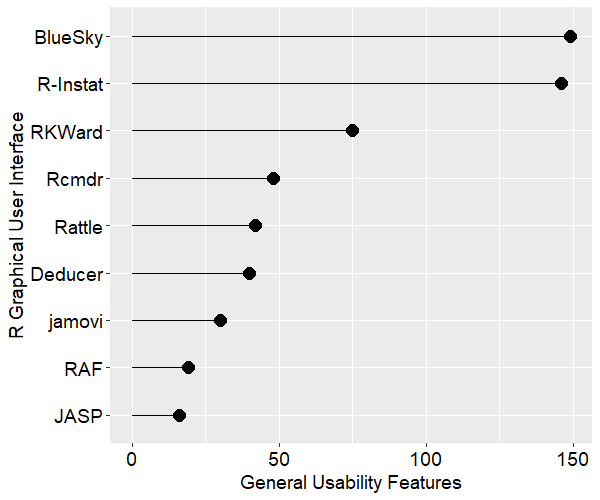
Figure 4 shows the number of graphics features offered by each GUI. R-Instat has a solid lead in this category. In fact, this underestimates R-Instat’s ability if you…

Continued…

Learn R and/or Data Management from Home January or April

R--67

If you want to learn R, or improve your current R skills, join me for two workshops that I’m offering through Revolution Analytics in January and April.

If you already know another analytics package, the workshop, Intro to R for SAS, SPSS and Stata Users may be for you. With each R concept, I’ll introduce it using terminology that you already know,  then translate it into R’s very different view of the world. You’ll be following along, with hands-on practice, so that by the end of the workshop R’s fundamentals should be crystal clear. The examples we’ll do come right out of my books, R for SAS and SPSS Users and R for Stata Users. That way if you need more explanation later, or want to dive in more deeply, the book of your choice will be very familiar. Plus, the table of contents and the index contain topics listed by SAS/SPSS/Stata terminology and R terminology so you can use either to find what you need. You can see a complete out line and register for the workshop starting January 13 (click here) or April 21 (click here).

If you already know R, but want to learn more about how you can use R to get your data ready to analyze, the workshop Managing Data with R will demonstrate how to use the 15 most widely used data management tasks. The course outline and registration is available here for January and here for April.

If you have questions about any of these courses, drop me a line a muenchen.bob@gmail.com. I’m always available to answer questions regarding any of my books or workshops.

Learn R and/or Data Management from Home October 7-11

R--67

If you want to learn R, or improve your current R skills, join me for two workshops that I’m offering through Revolution Analytics in October.

If you already know another analytics package, the workshop, Intro to R for SAS, SPSS and Stata Users may be for you. With each R concept, I’ll introduce it using terminology that you already know,  then translate it into R’s very different view of the world. You’ll be following along, with hands-on practice, so that by the end of the workshop R’s fundamentals should be crystal clear. The examples we’ll do come right out of my books, R for SAS and SPSS Users and R for Stata Users. That way if you need more explanation later, or want to dive in more deeply, the book of your choice will be very familiar. Plus, the table of contents and the index contain topics listed by SAS/SPSS/Stata terminology and R terminology so you can use either to find what you need. You can see a complete out line and register for the workshop here.

If you already know R, but want to learn more about data management, the workshop Managing Data with R will demonstrate how to use the 15 most widely used data management tasks. That course outline and registration is here.

If you have questions about any of these courses, drop me a line a muenchen.bob@gmail.com. I’m always available to answer questions regarding any of my books or workshops.