I’ve just updated another section of The Popularity of Data Science Software. It is reproduced below to save you the trouble of reading the entire article. If your organization is looking for training in the R language, you might consider my books, R for SAS and SPSS Users or R for Stata Users, or my on-site workshops.
Job Advertisements
One of the best ways to measure the popularity or market share of software for data science is to count the number of job advertisements for each. Job advertisements are rich in information and are backed by money so they are perhaps the best measure of how popular each software is now. Plots of job trends give us a good idea of what is likely to become more popular in the future.
Indeed.com is the biggest job site in the U.S., making its collection the best around. As their co-founder and former CEO Paul Forster stated, Indeed.com includes “all the jobs from over 1,000 unique sources, comprising the major job boards – Monster, Careerbuilder, Hotjobs, Craigslist – as well as hundreds of newspapers, associations, and company websites.” Indeed.com also has superb search capabilities and it includes a tool for tracking long-term trends.
Searching for jobs using Indeed.com is easy, but searching for software in a way that ensures fair comparisons across packages is tricky. Some software is used only for data science (e.g. SPSS, Apache Spark) while others are used in data science jobs and more broadly in report-writing jobs (e.g. SAS, Tableau). General-purpose languages (e.g. C, Java) are heavily used in data science jobs, but the vast majority of jobs that use them have nothing to do with data science. To level the playing field I developed a protocol to focus the search for each software within only jobs for data scientists. The details of this protocol are described in a separate article, How to Search for Data Science Jobs. All of the graphs in this section use those procedures to make the required queries.
I collected the job counts discussed in this section on February 24, 2017. One might think that a sample of on a single day might not be very stable, but the large number of job sources makes the counts in Indeed.com’s collection of jobs quite consistent. The last time I collected this data was February 20, 2014, and those that were collected using the same protocol (the general purpose languages) yielded quite similar results. They grew between 7% and 11%, and correlated r=.94, p=.002.
Figure 1a shows that SQL is in the lead with nearly 18,000 jobs, followed by Python and Java in the 13,000’s. Hadoop comes next with just over 10,000 jobs, then R, the C variants, and SAS. (The C, C++, and C# are combined in a single search since job advertisements usually seek any of them). This is the first time this report has shown more jobs for R than SAS, but keep in mind these are jobs specific to data science. If you open up the search to include jobs for report writing, you’ll find twice as many SAS jobs.
Next comes Apache Spark, which was too new to be included in the 2014 report. It has come a long way in an incredibly short time. For a detailed analysis of Spark’s status, see Spark is the Future of Analytics, by Thomas Dinsmore.
Tableau follows, with around 5,000 jobs. The 2014 report excluded Tableau due to its jobs being dominated by report writing. Including report writing will quadruple the number of jobs for Tableau expertise to just over 2o,ooo.
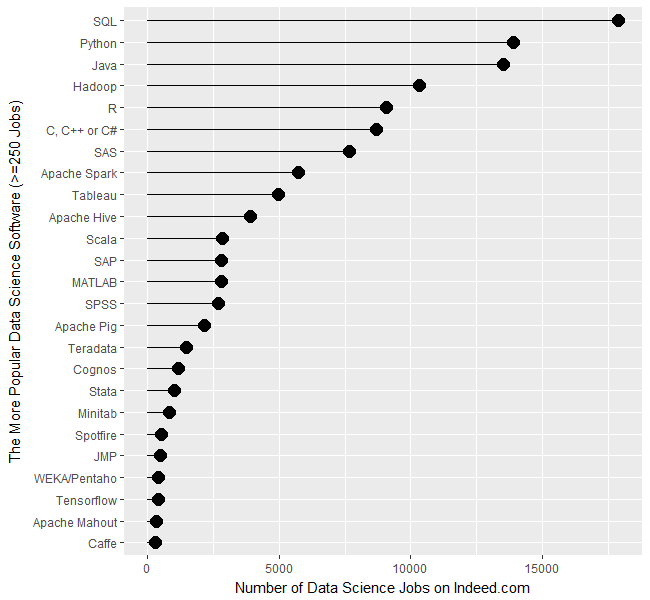
Apache Hive is next, with around 3,900 jobs, then a very diverse set of software comes next, with Scala, SAP, MATLAB, and SPSS, each having just over 2,500 data science jobs. After those, we see a slow decline from Teradata on down.
Much of the software had fewer than 250 job listings. When displayed on the same graph as the industry leaders, their job counts appear to be zero; therefore I have plotted them separately in Figure 1b. Alteryx comes out the leader of this group with 240 jobs. Microsoft was a difficult search since it appears in data science ads that mention other Microsoft products such as Windows or SQL Server. To eliminate such over-counting, I treated Microsoft different from the rest by including product names such as Azure Machine Learning and Microsoft Cognitive Toolkit. So there’s a good chance I went from over-emphasizing Microsoft to under-emphasizing it with only 157 jobs.

Next comes the fascinating new high-performance language Julia. I added FORTRAN just for fun and was surprised to see it still hanging in there after all these years. Apache Flink is also in this grouping, which all have around 125 jobs.
H2O follows, with just over 100 jobs.
I find it fascinating that SAS Enterprise Miner, RapidMiner, and KNIME appear with a similar number of jobs (around 90). Those three share a similar workflow user interface that make them particularly easy to use. The companies advertise the software as not needing much training, so it may be possible that companies feel little need to hire expertise if their existing staff picks it up more easily. SPSS Modeler also uses that type of interface, but its job count is about half that of the others, at 50 jobs.
Bringing up the rear is Statistica, which was sold to Dell, then sold to Quest. Its 36 jobs trails far behind its similar competitor, SPSS, which has a staggering 74-fold job advantage.
The open source MXNet deep learning framework, shows up next with 34 jobs. Tensorflow is a similar project with a 12-fold job advantage, but these two are both young enough that I expect both will be growing rapidly in the future.
In the final batch that has few, if any, jobs, we see a few newcomers such as DataRobot and Domino Data Labs. Others have been around for years, leaving us to wonder how they manage to stay afloat given all the competition.
It’s important to note that the values shown in Figures 1a and 1b are single points in time. The number of jobs for the more popular software do not change much from day to day. Therefore the relative rankings of the software shown in Figure 1a is unlikely to change much over the coming year. The less popular packages shown in Figure 1b have such low job counts that their ranking is more likely to shift from month to month, though their position relative to the major packages should remain more stable.
Each software has an overall trend that shows how the demand for jobs changes across the years. You can plot these trends using Indeed.com’s Job Trends tool. However, as before, focusing just on analytics jobs requires carefully constructed queries, and when comparing two trends at a time, they both have to fit in the same query limit. Those details are described here.
I’m particularly interested in trends involving R so let’s see how it compares to SAS. In Figure 1c we see that the number of data science jobs for SAS has remained relatively flat from 2012 until February 28, 2017 when I made this plot. During that same period, jobs for R grew steadily and finally surpassed jobs for SAS in early 2016. As noted in a blog post (and elsewhere in this report), use of R in scholarly publications surpassed those for SAS in 2015.

- Figure 1c. Data science job trends for R (blue) and SAS (orange).
A long-standing debate has been taking place on the Internet regarding the relative place of Python and R. Ironically, this debate about data science software has involved very little actual data. However, it is possible now to at least study the job trends. Figure 1a showed us that Python is well out in front of R, at least on that single day the searches were run. What has the data looked like over time? The answer is shown in Figure 1d.

- Figure 1d. Jobs trends for R (blue & lower) and Python (orange & upper).
As we see, Python surpassed R in terms of data science jobs back in 2013. These are, of course, very different languages and a quick scan of job descriptions will show that the R jobs are much more focused on the use of existing methods of analysis, while the Python jobs have more of a custom-programming angle to them.
