by Robert A. Muenchen, updated 8/23/2023
Introduction
Rattle is a popular free and open-source Graphical User Interface (GUI) for the R software, one that focuses on beginners looking to point-and-click their way through machine learning tasks. Such tasks are also referred to as artificial intelligence or predictive analytics. Rattle’s name is an acronym for “R Analytical Tool To Learn Easily.” Rattle is available on Windows, Mac, and Linux systems.
This post is one of a series of reviews that aim to help non-programmers choose the best GUI for their needs. Additionally, these reviews include a cursory description of each GUI’s programming support.
This is one of a series of reviews that aim to help non-programmers choose the Graphical User Interface (GUI) for R that is best for them. Additionally, these reviews include cursory descriptions of the programming support that each GUI offers. I have joined the BlueSky Statistics development team and have written the BlueSky User Guide (online here), but you can trust this series of reviews, as I describe here. All my comments below are easily verifiable. There is no perfect user interface for everyone; each GUI for R has features that appeal to different people.
Terminology
There are various definitions of user interface types, so here’s how I’ll be using the following terms. Reviewing R GUIs keeps me quite busy, so I don’t have time also to review all the IDEs, though my favorite is RStudio.
GUI = Graphical User Interface using menus and dialog boxes to avoid having to type programming code. I do not include any assistance for programming in this definition. So, GUI users are people who prefer using a GUI to perform their analyses. They don’t have the time or inclination to become good programmers.
IDE = Integrated Development Environment, which helps programmers write code. I do not include point-and-click style menus and dialog boxes when using this term. IDE users are people who prefer to write R code to perform their analyses.
Installation
The various user interfaces available for R differ greatly in how they’re installed. Some, such as jamovi or RKWard, install in a single step. Others install in multiple steps, such as R Commander (two steps) and Deducer (up to seven steps). Advanced computer users often don’t appreciate how lost beginners can become while attempting even a simple installation. The Help Desks at most universities are flooded with such calls at the beginning of each semester!
The steps to install Rattle are relatively complex since it is currently not working with the most recent versions of R. It is best to check for the latest version of instructions at https://rattle.togaware.com/. I include a set here to demonstrate that while many R GUIs install in a single step, Rattle’s is relatively complex:
- Install an older version of R. See which version is allowed at https://rattle.togaware.com/.
- In R, install the toolkit that Rattle is written in by executing the command: install.packages(“RGtk2”)
- Also, in R, install Rattle itself by executing the command:
install.packages(“rattle”, dependencies=TRUE)
Note that while Rattle’s name is capitalized, the name of the rattle package is spelled in all lower-case letters! - If you wish to take advantage of interactive visualization, then install the GGobi software from: http://www.ggobi.org/downloads/.
- You will need an older version of RStudio if you also wish to use that popular software. See https://rattle.togaware.com/ to see which ones work.
Plug-in Modules
When choosing a GUI, one of the most fundamental questions is: what can it do for you? What the initial software installation of each GUI gets you is covered in the Graphics, Analysis, and Modeling sections of this series of articles. Regardless of what comes built-in, it’s good to know how active the development community is. They contribute “plug-ins,” which add new menus and dialog boxes to the GUI. This level of activity ranges from very low (RKWard, Deducer) through moderate (jamovi) to very active (R Commander).
Rattle’s complete capability was designed and programmed by Graham Williams of Togaware. As a result, it doesn’t have plug-ins, but it does include a comprehensive set of machine learning tools.
Startup
Some user interfaces for R, such as jamovi, start by double-clicking on a single icon, which is great for people who prefer not to write code. Others, such as R commander and JGR, have you start R, then load a package from your library and call a function. That’s better for people looking to learn R, as those are among the first tasks they’ll have to learn anyway.
Rattle is run as a part of R itself, so the steps to start it begin with starting R:
- Start R.
- Load Rattle from your library by executing the command: library(“rattle”)
- Start Rattle by executing the command: rattle()
Data Editor
A data editor is a fundamental feature in data analysis software. It puts you in touch with your data and lets you get a feel for it, if only in a rough way. A data editor is such a simple concept that you might think there would be hardly any differences in how they work in different GUIs. While there are technical differences, to a beginner, what matters the most are the differences in simplicity. Some GUIs, including jamovi, let you create only what R calls a data frame. They use more common terminology and call it a data set: you create one, you save one, later you open one, then you use one. Others, such as RKWard, trade this simplicity for the full R language perspective: a data set is stored in a workspace. So the process goes: you create a data set, you save a workspace, you open a workspace, and choose a data set from within it.
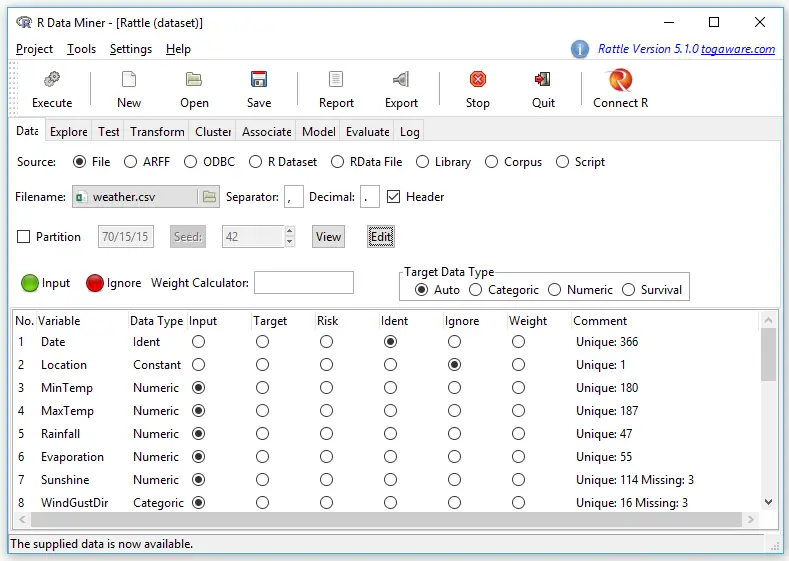
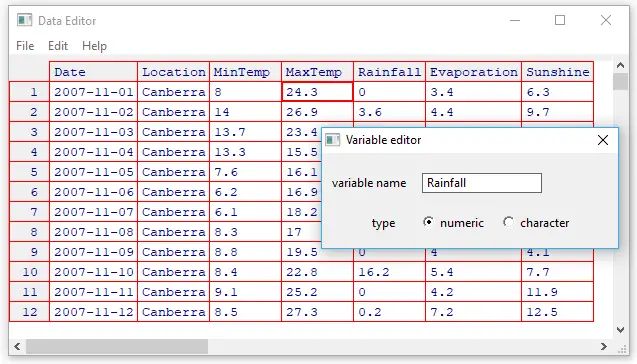
Rattle’s data editor is unique for a GUI because it does not offer a way to create a data set. It lets you edit any data set you open using R’s built-in edit function, but that function offers very few features. Clicking on a variable name will cause a dialog to open, offering to change the variable’s name or type as numeric or character (see Figure 2). Rattle automatically converts variables with fewer than 10 values into “categorical” ones. R would call these factors. You can always recode variables from numeric to categorical (or vice versa) in the “Transform” tab (see Data Management section).
Data Import
Since R GUIs use R to do the work behind the scenes, they often include the ability to read a wide range of files, including SAS, SPSS, and Stata. Some, like BlueSky Statistics, also include the ability to read directly from SQL databases. Of course, you can always use R code to import data from any source and then continue to analyze it using any GUI, but the point of GUIs is to avoid programming.
Rattle skips many standard statistical data formats, but it includes a couple of rarely supported ones, such as the Attribute-Relation File Format used by other data mining tools. It also includes “corpus,” which imports text documents, and it then performs the popular tf-idf calculation to prepare them for analysis using the other numerically-based analysis methods.
On its “Data” tab, Rattle offers several formats:
- File: CSV
- File: TXT
- File: Excel
- Attribute-Relation File Format (ARFF)
- Open Database Connectivity (ODBC)
- R Dataset
- RData File
- Library
- Corpus (for text analysis)
- Script
Data Management
It’s often said that 80% of data analysis time is spent preparing the data. Variables need to be transformed, recoded, or created; strings and dates need to be manipulated; missing values need to be handled; datasets need to be stacked or merged, aggregated, transposed, or reshaped (e.g., from wide to long and back). A critical aspect of data management is the ability to transform many variables simultaneously. For example, social scientists need to recode many survey items; biologists need to take the logarithms of many variables. Doing these types of tasks one variable at a time can be tedious. Some GUIs, such as jamovi and RKWard, handle only a few of these functions. Others, such as BlueSky Statistics or the R Commander, can handle all, or nearly all, of these tasks.
Rattle provides minimal data management tools. Its designer focused on reading a single data set and making transformations common in data mining projects quick and easy. More complex data management tasks are left to other tools.
Rattle’s “Transform” tab cycles through various data management “types.” The way it works is quite unique. As shown in Figure 3, I have selected the Transform tab by clicking on it. I then held the CTRL key down to select several variables that are highlighted in blue. If the variables had been next to one another, I could have clicked on the first one, then shift-clicked on the last to select them all. Next, I chose my transformation by choosing “Recode” and then “Recenter.” Finally, I clicked the “Execute” button (or F2) to complete the process by adding three new recoded variables to the data set. Original variables are never changed, and you never have the ability to choose the name of the new variable(s). A prefix is appended to the variable name(s) automatically to speed up the process. In this case, my Rainfall variable was transformed into “RRC_Rainfall.” The RRC prefix stands for “Recoded, Re-Centered.”
Whenever a variable is transformed, its status in the “Data” tab switches from “Input” to “Ignore,” while the transformed version of the variable enters the data with an “Input” role.
As easy as some transformations are, other transformations are impossible. For example, if you had a formula to calculate recommended daily allowances of vitamins, there’s no way to do it. Conditional transformations, those which have different formulas for different subsets of the observations (e.g., daily allowances of vitamins calculated differently for men and women), are also not possible. Here are the available transformations:
Transform> Rescale> Normalize
- Recenter (Z-score)
- Scale 0 to 1
- (Var – Median)/Mean Absolute Deviation (MAD)
- Natural Log
- Log 10
- Matrix (divide all by a constant)
- Rank
- Interval
- Groups
Transform> Impute
- Replace missing with zeros (e.g., requesting nothing gets you nothing)
- Mean
- Median
- Mode
- Constant
Transform> Recode
- Binning> Quantiles
- Binning> KMeans clusters
- Binning> Equal width intervals
- Binning> N Equally spaced intervals
- Indicator variables
- Join Categorics
- As Categoric
- As Numeric
Transform> Cleanup
- Delete ignored
- Delete selected
- Delete missing
- Delete obs with missing
Menus & Dialog Boxes
The goal of pointing & clicking your way through analysis is to save time by recognizing menu settings rather than performing the more difficult task of recalling programming commands. Some GUIs, such as jamovi, make this easy by sticking to menu standards and using simpler dialog boxes; others, such as RKWard, use non-standard menus that are unique to it and hence require more learning.
Rattle uses an entirely unique user interface, one that differs from all the other GUIs covered in this series of reviews. Most of the time, I found this interface easy to use. However, for some tasks, the novelty of its style had me searching for quite a while for the task I needed to complete.
As shown in Figure 1, Rattle has a set of tabs across the top, similar to Microsoft Office or a browser with several windows open. Their order of appearance from left to right mirrors the steps you follow when analyzing data. First, you have to read “Data,” then “Explore” it, decide how to “Transform” it, and then choose from one of three general types of analyses: “Cluster” observations (i.e., find groups with no variable to predict), “Associate” values (i.e., study co-occurrences), “Model” predictions (i.e., predict the value of a measurement, or predict membership in a group). Then you “Evaluate” your models, comparing them to choose the best. Finally, if you want to learn R programming, the “Log” will show you how Rattle performed all its steps.
At each step, you must configure the tab’s settings and press the “Execute” button (or F2) before the settings have any effect. Rattle intercepts some messages from R and shows them to you, but some of them end up in the R console that you used to start Rattle. So it’s best to have that window in sight at all times.
The variable roles you set in the “Data” tab determine what’s possible in all the other tabs. Setting the “target” variable (a.k.a. dependent variable), the “input” variables (independent variables), and the variables to “ignore” will maintain those roles on all the following steps in the analysis. If you change those roles, don’t forget to click the “Execute” button to effect the changes!
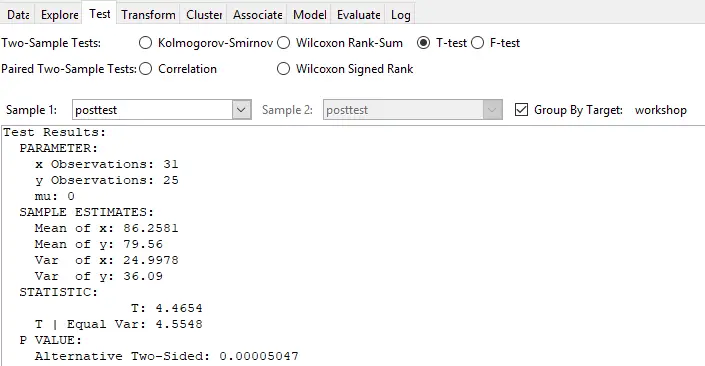
Statistical tests are all performed under the “Test” tab (see Figure 4). There you choose a test with a radio button, then choose one continuous variable in the “Sample 1” menu, and check the “Group By Target:” box. For paired samples, you can enter the second continuous variable in the “Sample 2” box. However, the most popular paired sample T-test is not implemented. Rattle is so focused on its machine learning roots that to perform a series of comparisons on different groups requires returning to the Data tab, choosing a new target, then returning to the Test tab and executing it again! All the other R GUIs let you choose the group variable and the continuous variables using the same dialog box, which is much quicker.
A common form of analysis, cross-tabulation, is located under “Explore> Summary> Crosstab.” Running it will cause all the categorical variables to cross-tabulate with the target variable. There is no way to directly request a cross-tabulation of just two variables as there is in every other GUI covered in this series of reviews. To change which variables are used in cross-tabulations, you could tell Rattle to “ignore” more variables on the Data tab or use “Transform> Recode> As Categoric” to determine which to view as categorical since only that type will be used. The “Log” tab shows that the CrossTable function from the descr package is used to create the cross-tabulations. That function can calculate a chi-squared test which is commonly done for such tables, but the GUI offers no way to make that happen. You would have to learn how to modify the code, copy it to your R console, then submit it to get that test.
Many of your dialog box settings are saved when you choose “Project> Save as.” That creates a file with the extension of “.rattle”. Projects save all your settings, models, and graphs.
Documentation & Training
Rattle is documented extensively in Graham William’s book Data Mining with Rattle and R. I review that excellent book here.
There are over 1,400 videos on YouTube showing how to accomplish many different tasks using Rattle.
Help
R GUIs provide simple task-by-task dialog boxes, which generate much more complex code. So for a particular task, you might want to get help on 1) the dialog box’s settings, 2) the custom functions it uses (if any), and 3) the R functions that the custom functions use. Nearly all R GUIs provide all three levels of help when needed. The notable exception to that is jamovi, which provides no help, and the R Commander, which lacks help on the dialog boxes themselves.
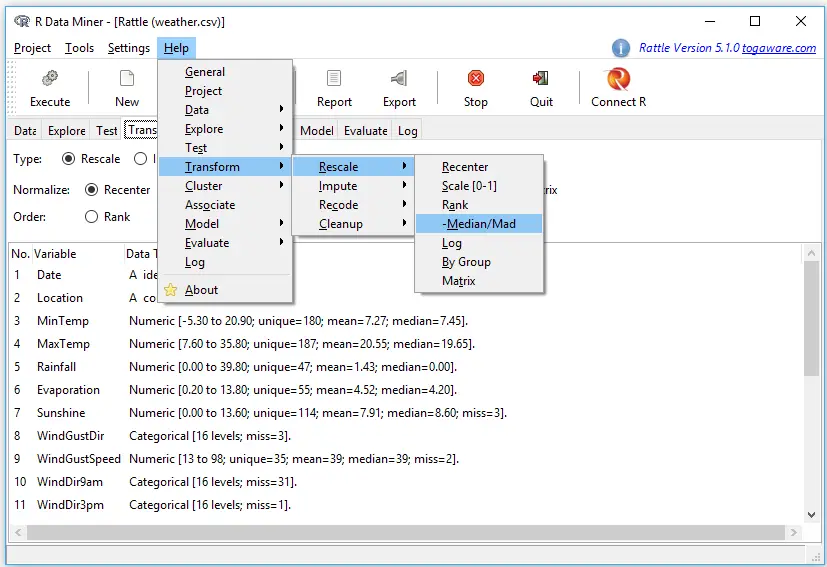
Rattle’s help menu is shown in Figure 5. It offers help for each tab, and for those tabs that include sub-tabs, another menu pops out the side. In Figure 5, I clicked on “Help” and then pointed at “Transform.” The sub-menu appeared, and I pointed at “Rescale” and then “-Median/Mad.” A help box popped up saying this choice will subtract the median from the original variable, then divide by the Median Absolute Deviation (MAD), which it also defined.
The R functions used are defined at the end of many help files (some are perfectly clear as is), and it asks if you would like Rattle to show you R’s original help file on those functions.
Graphics
The various GUIs available for R handle graphics in several ways. Some, such as RKWard, focus on R’s built-in graphics. Others, such as BlueSky Statistics, focus more on graphics from the popular ggplot2 package.
GUIs also differ greatly in how they control the style of the graphs they generate. Ideally, you could set the style once, and then all graphs would follow it. Jamovi and BlueSky Statistics both work that way.
Rattle uses various packages to create graphics (e.g., Figure 6), so their appearance differs, and there is no way to standardize their style within Rattle. You could use R code to change their appearance by editing the R code in the “Log” tab and submitting it in an R console.
The types of graphs that Rattle provides follow its focus on data mining, and you create them in the data mining process flow:
- Boxplots
- Histogram / Density
- Cumulative
- Benford
- Pairs (correlation plot)
- Hierarchical (dendogram of correlations)
- Missing Values
- Principal Components Importance Barplot
- Principal Components Biplot
- Cluster Data (scatterplots of clusters)
- Cluster Discriminant Coordinates
- Cluster Weights Heatmap
- Associate Frequency Plot
- Associate Rule Plot
- Decision Tree Plot
- R’s plot Function on Generalized Linear Models
- Risk Chart
- Cost Curve
- Hand Curve
- Lift Plot
- ROC Plot
- Precision Plot
- Sensitivity Plot
- Predicted vs. Observed
Rattle doesn’t include a graphic display window, so the graphs appear in window provided by the R software that you use to start Rattle.
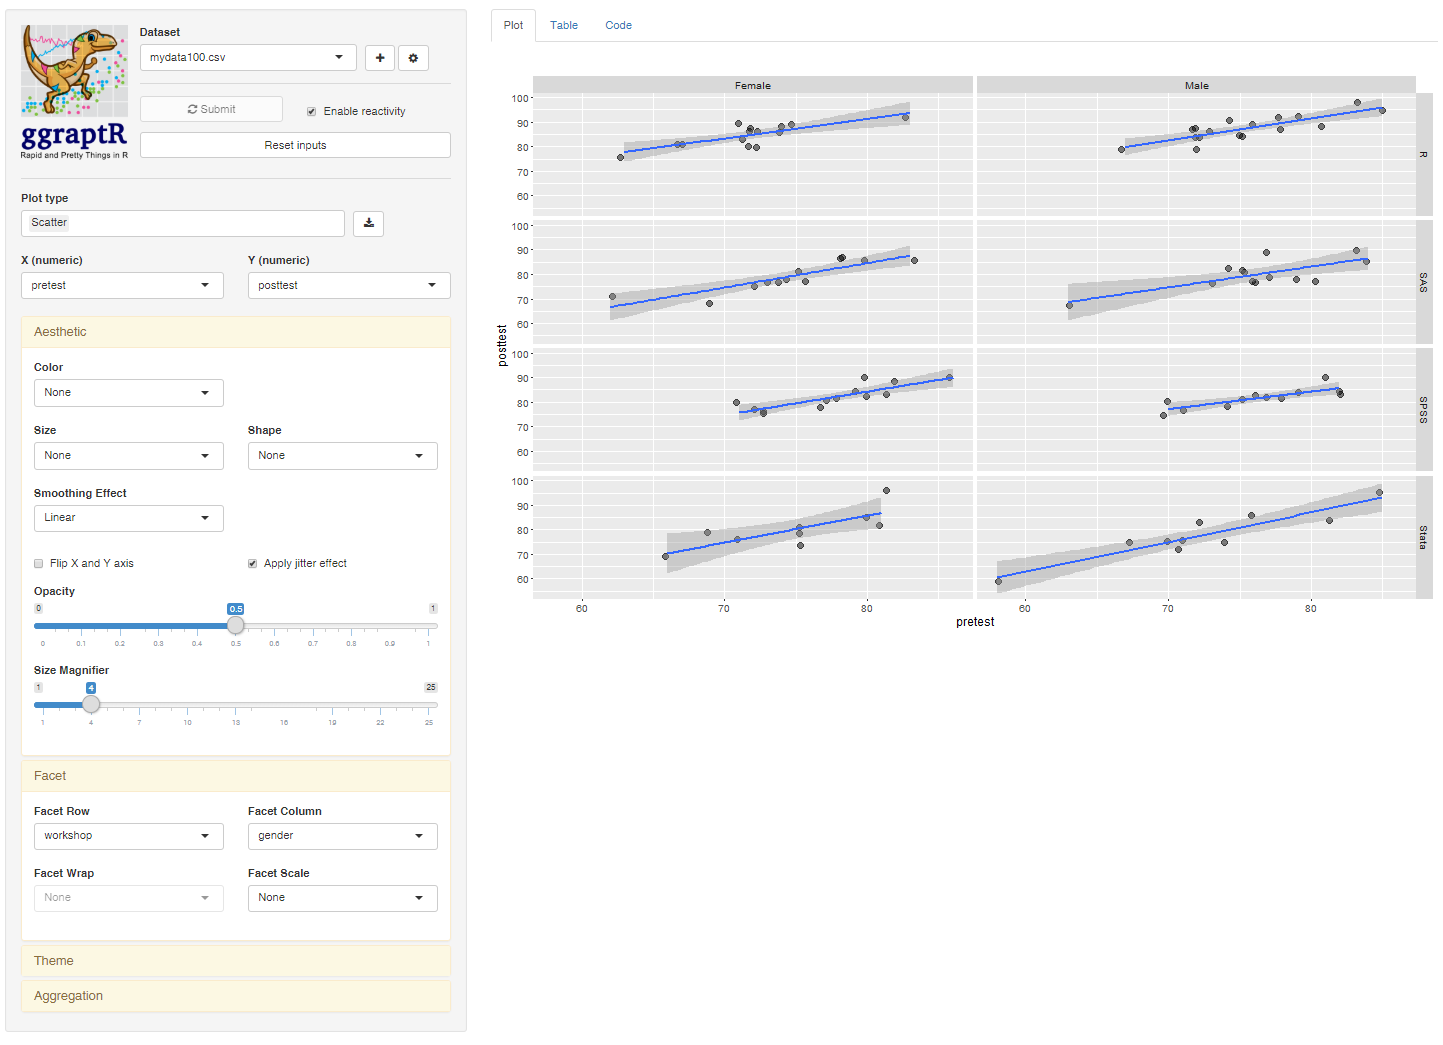
Note that there is no “Graphics” menu, as nearly all the other GUIs offer. Rattle’s graphics are done within the analysis steps (jamovi uses this approach too). The exception comes from its unique integration with the ggraptR software. That application allows you to create complex plots interactively using the ggplot2 package. Choosing “Explore> Interactive> GGRaptR” displays the interface shown in Figure 7. This application is nearly as powerful as Deducer’s Plot Builder plug-in, missing only the ability to add additional layers to a plot (e.g., jittered points on top of a boxplot).
A more interactive style of plot is available under “Explore> Interactive> GGobi.” GGobi offers scatterplots, bar charts, parallel coordinate plots, and projection pursuit tours, all with multiple linked windows and brushing. This lets you select observations in any given plot and see those same observations highlighted in all plots.
Modeling
The way statistical models (which R stores in “model objects”) are created and used is an area where R GUIs differ the most. The simplest and least flexible approach is taken by jamovi and RKWard. They try to do everything you might need in a single dialog box. They either don’t save models, or they do nothing with them. To an R programmer, that sounds extreme since R can do many tasks using model objects. However, neither SAS nor SPSS were able to save models for their first 35 years of existence, so each approach has its merits. Other GUIs, such as the R Commander or Bluesky Statistics let you save models and have other dialog boxes that let you do various additional tasks with them.
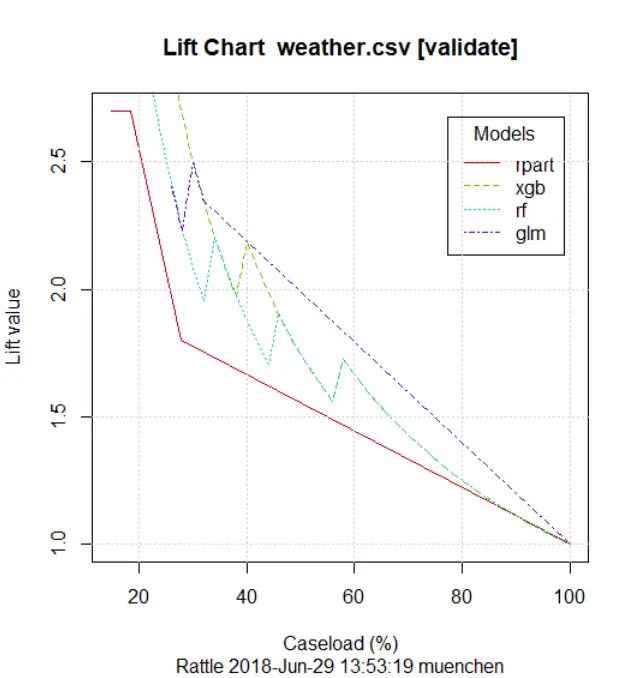
Rattle creates models within an interactive session, and during that session, it can do various things with them. For example, “Evaluate> Lift” created the plot shown in Figure 5. You can also use “Evaluate> Score” to open a new data set and use all the models you chose (via checkboxes) to make predictions. The models are saved when you save a project.
An important limitation to be aware of is that Rattle’s modeling does not allow you to control model formulas; they are strictly additive. For example, if you wanted to add an interaction term in a linear regression, you would have to copy the code from the “Log” tab to the R console of your choosing, add the model formula you wanted, then execute it. Once outside the Rattle environment, you would not be able to use the tools on its “Evaluate” tab to compare that model to others.
Analysis Methods
Most of the R GUIs offer a reasonable set of statistical analysis methods. Some also offer machine learning methods too. Since Rattle focuses on data mining and machine learning, let’s take a look at those first. They include:
- Cluster> KMeans
- Cluster> Entropy-Weighted KMeans (Ewkm)
- Cluster> Hierarchical
- Cluster: BiCLuster
- Association Rules
- Model> Decision Tree> Traditional (rpart)
- Model> Decision Tree> Conditional (ctree)
- Model> Random Forest> Traditional (randomForest)
- Model> Random Forest> Conditional (cforest)
- Model> Boosted Trees> Adaptive (adaboost)
- Model> Boosted Trees> Extreme (xgb)
- Model> Support Vector Machine (SVM)> Radial Basis (rbfdot)
- Model> Support Vector Machine (SVM)> Polynomial (polydot)
- Model> Support Vector Machine (SVM)> Linear (vanilladot)
- Model> Support Vector Machine (SVM)> Hyperbolic Tangent (tanhdot)
- Model> Support Vector Machine (SVM)> Laplacian (laplacedot)
- Model> Support Vector Machine (SVM)> Bessel (besseldot)
- Model> Support Vector Machine (SVM)> ANOVA RBF (anovadot)
- Model> Support Vector Machine (SVM)> Spline (splinedot)
- Model> Linear Models> Numeric
- Model> Linear Models> Generalized
- Model> Linear Models> Poisson
- Model> Linear Models> Logistic
- Model> Linear Models> Probit
- Model> Linear Models> Multinomial
- Neural Network
- Survival
Rattle’s list of statistical tests is relatively sparse, lacking such basics as the chi-squared test, proportion test, paired t-test, and even one-way analysis of variance. The tests included are:
- Kolmogorov-Smirnov (only for two groups)
- Wilcoxon Rank-Sum
- T-test on independent samples
- F-test for variances
- Pearson Correlation
- Spearman Correlation
- Kendall Correlation
- Wilcoxon Signed Rank
Generated R Code
One of the aspects that most differentiates the various GUIs for R is the code they generate. If you decide you want to save code, what type of code is best for you? The base R code as provided by the R Commander, which can teach you “classic” R? The “tidyverse” code often used by BlueSky Statistics? The concise functions that mimic the simplicity of one-step dialogs, such as jamovi provides? The completely transparent (and complex) code provided by RKWard, which might be the best for budding R power users?
Rattle uses classic R code, rarely using newer tools such as the tidyverse packages. Since Rattle is focused on machine learning, you might expect it to take advantage of newer packages in that area, such as tidymodels, caret or mlr, but it doesn’t. That means Rattle is missing useful features such as model tuning or cross-validation. But it also means that its code is very simple to use and understand.
Rattle writes code that is date and time-stamped, generously annotated, and made easy to read thanks to plenty of blank lines and indented continuation lines. The variables are clearly assigned their roles with code like this:
# The following variable selections have been noted.

crs$input <- c("id", "workshop", "q1", "q2", "q3", "q4",
               "pretest", "posttest")

crs$numeric <- c("id", "q1", "q2", "q3", "q4", "pretest", "posttest")

crs$categoric <- "workshop"
And then used in analyses like this decision tree:
# Build the Decision Tree model.

crs$rpart <- rpart(gender ~ .,
    data=crs$dataset[crs$train, c(crs$input, crs$target)],
    method="class",
    parms=list(split="information"),
    control=rpart.control(usesurrogate=0,
    maxsurrogate=0))
Support for Programmers
Some of the GUIs reviewed in this series of articles include extensive support for programmers. For example, RKWard offers much of the power of Integrated Development Environments (IDEs) such as RStudio or Eclipse StatET. Others, such as jamovi or the R Commander, offer little more than a simple text editor.
Rattle works as an adjunct to R IDEs, so it doesn’t include any support for submitting its own code. It will, however, allow you to edit its “Log” in a simple text editor before saving it or pasting it into an IDE.
The developer offers support for programmers in another way, with templates to help get started on programming in the form of programming “templates” and “one-pagers” here.
Reproducibility & Sharing
One of the biggest challenges that GUI users face is being able to reproduce their work. Reproducibility is useful for re-running everything on the same dataset if you find a data entry error. It’s also useful for applying your work to new datasets so long as they use the same variable names (or the software can handle name changes). Some scientific journals ask researchers to submit their files (usually code and data) along with their written report so that others can check their work.
As important a topic as it is, reproducibility is a problem for GUI users, a problem that has only recently been solved by some software developers. Most GUIs (e.g., the R Commander, SPSS) save only code, but since the GUI user didn’t write the code, they also can’t read it or change it! Others, such as jamovi and RKWard, save the dialog box entries and allow GUI users to have reproducibility in the form they prefer.
While Rattle’s project files will save which data set you’re working on and the roles of each variable, they don’t save anything else. So full reproducibility of your work in Rattle requires saving the R code that it creates and stores in its “Log” tab. There’s no way to get back to re-populate all the tab settings when starting from the saved code.
If you wished to share your work with a colleague, you would send them your project file and your data set. You could also save the contents of the “Log” tab and send them the complete R code since running that is the only way they’ll see a cumulative output file (See Output & Report Writing below).
Since Rattle contains few custom functions, there’s a good chance they could run your code directly. However, it would be wise for them to install the rattle package for a few custom functions, such as the popular decision tree viewer, fancyRpartPlot.
Output & Report Writing
Ideally, output should be clearly labeled, well organized, and of publication quality. It might also delve into the realm of word processing through Sweave/knitr and R Markdown documents. Some, like BlueSky and jamovi, have those features. Others do not. See the separate reviews to see how each other package is doing on this topic.
As soon as you click the Execute button (or F2), the output from your chosen analysis appears at the bottom of Rattle’s main control screen. It’s R’s standard monospaced output with no additional formatting. As you do each task, Rattle replaces the contents of the output window rather than append it to the bottom of the previous output, as is usually the case in other R GUIs. If you want a cumulative report, you have to cut and paste it into a word processor as you go or save the R code from the “Log” tab to execute in the R console of your choosing.
Group-By Analyses
Repeating an analysis on different groups of observations is a core task in data science. Software needs to provide the ability to select a subset of one group to analyze, then another subset to compare it to. Of the GUIs for R reviewed in this series, Rattle was the only one that lacked this fundamental ability. You would have to use R code or another tool to break your data into subsets before reading each into Rattle one at a time.
Software also needs the ability to automate such selections so that you might generate dozens of graphs or analyses, one group at a time. While this has been available in commercial GUIs for decades (e.g., SPSS split-file, SAS BY), Rattle does not offer it. Of the GUIs reviewed, BlueSky Statistics is the only one that does.
Output Management
Early in the development of statistical software, developers tried to guess what output would be important to save to a new dataset (e.g., predicted values, factor scores), and the ability to save such output was built into the analysis procedures themselves. However, researchers were far more creative than the developers anticipated. To better meet their needs, output management systems were created and tacked on to existing tools (e.g., SAS’ Output Delivery System, SPSS’ Output Management System). One of R’s greatest strengths is that every bit of output can be readily used as input. However, with the simplification that GUIs provide, that’s a challenge.
Output data can be observation-level, such as predicted values for each observation or case. When group-by analyses are run, the output data can also be observation-level, but now the (e.g.) predicted values would be created by individual models for each group rather than one model based on the entire original data set (perhaps with the group included as a set of indicator variables).
Group-by analyses can also create model-level data sets, such as one R-squared value for each group’s model. They can also create parameter-level data sets, such as the p-value for each regression parameter for each group’s model. (Saving and using single models is covered under “Modeling” above.)
For example, in our organization, we have 250 departments and want to see if any have a gender bias on salary. We write all 250 regression models to a data set and then search to find those whose gender parameter is significant (hoping to find none, of course!)
Rattle offers only observation-level output management, and even then, it is limited to predicted values or predicted group membership.
Developer Issues
You can provide Rattle feedback and request new features its this website. However, there is not an easy way to write your own plug-ins to Rattle as there is for many of the other GUIs reviewed in this series.
Conclusion
Just a few years ago, Rattle was easy to recommend for people who wanted to focus on learning machine learning methods. However, now several other R GUIs, such as JASP and BlueSky Statistics offer more ML methods, are as easy to use, and install in a single step. Rattle’s incompatibility with recent versions of R and RStudio also gives me pause. However, on 8/22/2023, Rattle’s developer, Graham Williams, announced that a major new version is in the works. He encourages Rattle users interested in coding and learning a modern language platform (Flutter) who would like to contribute to the next generation of Rattle (based on R and Python) to contact him at Graham.Williams@anu.edu.au. I wish him luck and look forward to reviewing this new version, so stay tuned!
For a summary of all my R GUI software reviews, see the article, R Graphical User Interface Comparison.
Acknowledgements
Thanks to Graham Williams for the hard work that went into creating Rattle and for making it freely available to all. Graham also made many suggestions that improved this article. Thanks also to Rachel Ladd, Ruben Ortiz, Christina Peterson, and Josh Price for their editorial suggestions.