BlueSky Statistics Base is a free graphical user interface for the powerful R language. There is also a commercial “Pro” version that offers tech support, priority feature requests, and many powerful additional features. The Pro version has been beefed up considerably with the new features below. These features apply to quality control, general statistics, team collaboration, project management, and scripting. Many are focused on quality control and Six Sigma as a result of requests from organizations migrating from Minitab and JMP. However, both versions of BlueSky Statistics offer a wide range of statistical, graphical, and machine-learning methods.
The free version saves every step of the analysis for full reproducibility. However, repeating the analysis is a step-by-step process. The Pro version can now rerun the entire set at once, substituting other datasets when needed.
You can obtain either version at https://BlueSkyStatistics.com. A detailed review is available at https://r4stats.com/articles/software-reviews/bluesky/. If you plan to attend the Joint Statistical Meetings (JSM) in Portland next week, stop by Booth 406 to get a demonstration. We hope to see you there!
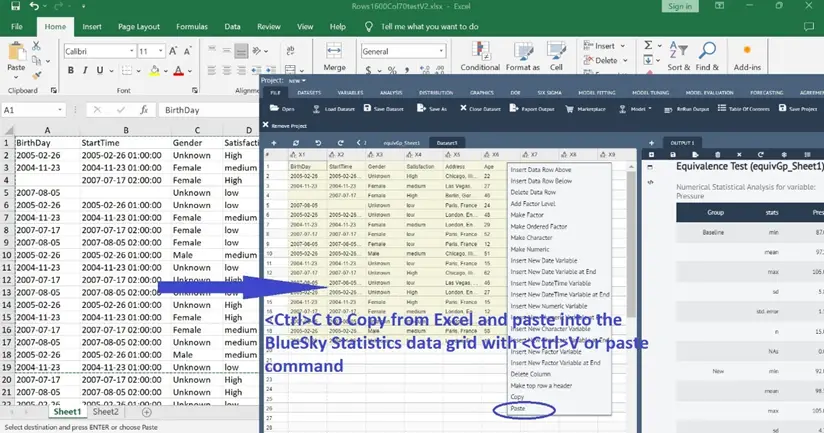
Copy and Paste data from Excel
Copy data from Excel and paste it into the BlueSky Statistics data grid. This is in addition to the existing mechanism of bringing data through file import for various file formats into BlueSky Statistics to perform data analysis.
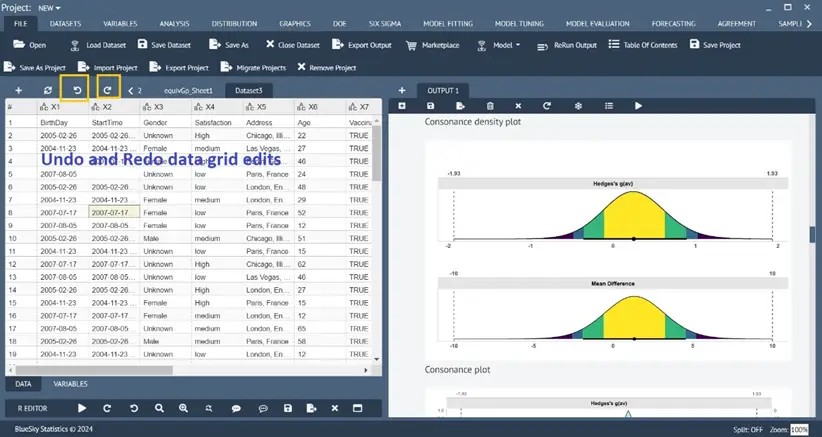
Undo/Redo data grid edits
Single-item and muti-items data element edits can be discarded by undo and restored by redo operations.
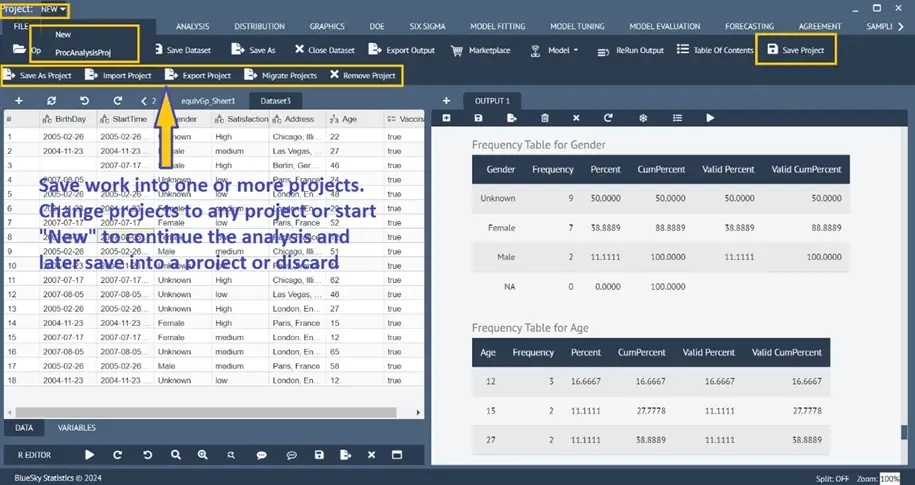
Project save/open to save/open all work (all open datasets and output analysis)
Analysis performed can be saved into one or more projects. Each project contains all the datasets along with all the analyses and any R code from the editor. The projects can be exported and shared (sent as .bsp, which is a zip file; “bsp” is an abbreviation of BlueSky Statistics Project) with other BlueSky Statistics users. The users can import projects, see all the datasets and analyses stored in the projects, and subsequently add/modify/rerun all the analyses.
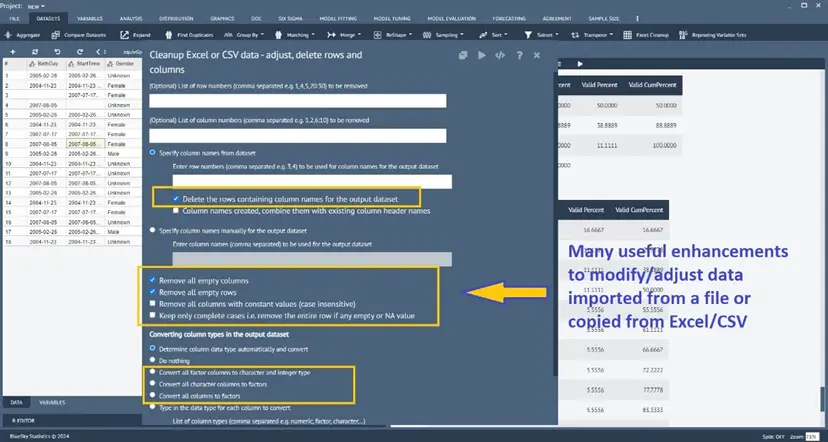
Enhanced cleaning/adjustment of copied/imported Excel/CSV data on the Datagrid
Dataset > Excel Cleanup
There are a few enhancements made to offer additional data cleanup/adjustment options to the existing Excel Cleanup dialog to clean/adjust (i.e., rows. Columns, data type, etc.) data on the BlueSky Statistics data grid, irrespective of how the data was loaded into the data grid with the file open option or by copying and pasting from Excel/CSV file.
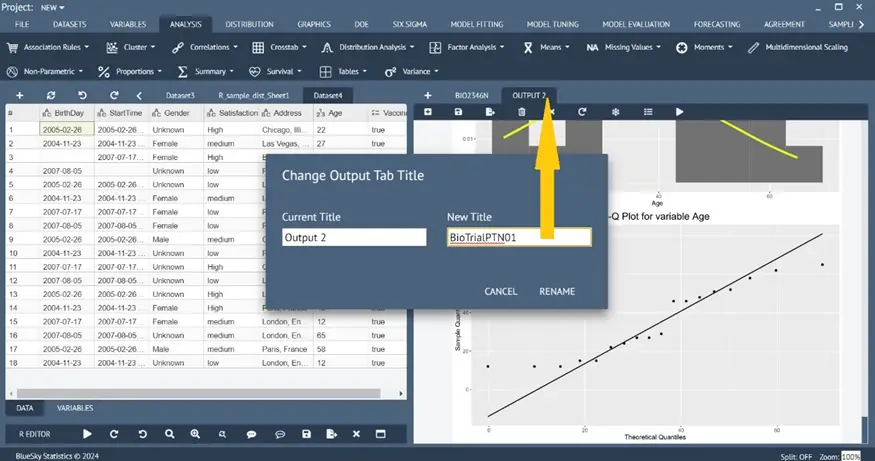
Renaming output tabs
Double-clicking on the output tab will open a dialog box asking for the new name. The user can type in a name to rename the output tab.
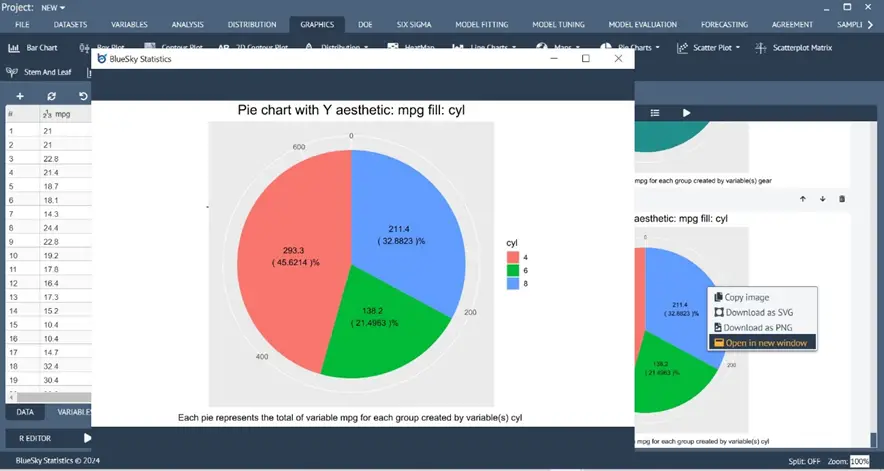
Enhanced Pie Chart and Bar Chart
Graphics > Pie Charts > Pie Chart
Graphics > Bar Chart
The pie chart and bar chart have been enhanced to show % and counts on the plot.
Scatterplot Matrix
Graphics > Scatterplot Matrix
The Scatter Plot Matrix dialog has been added.

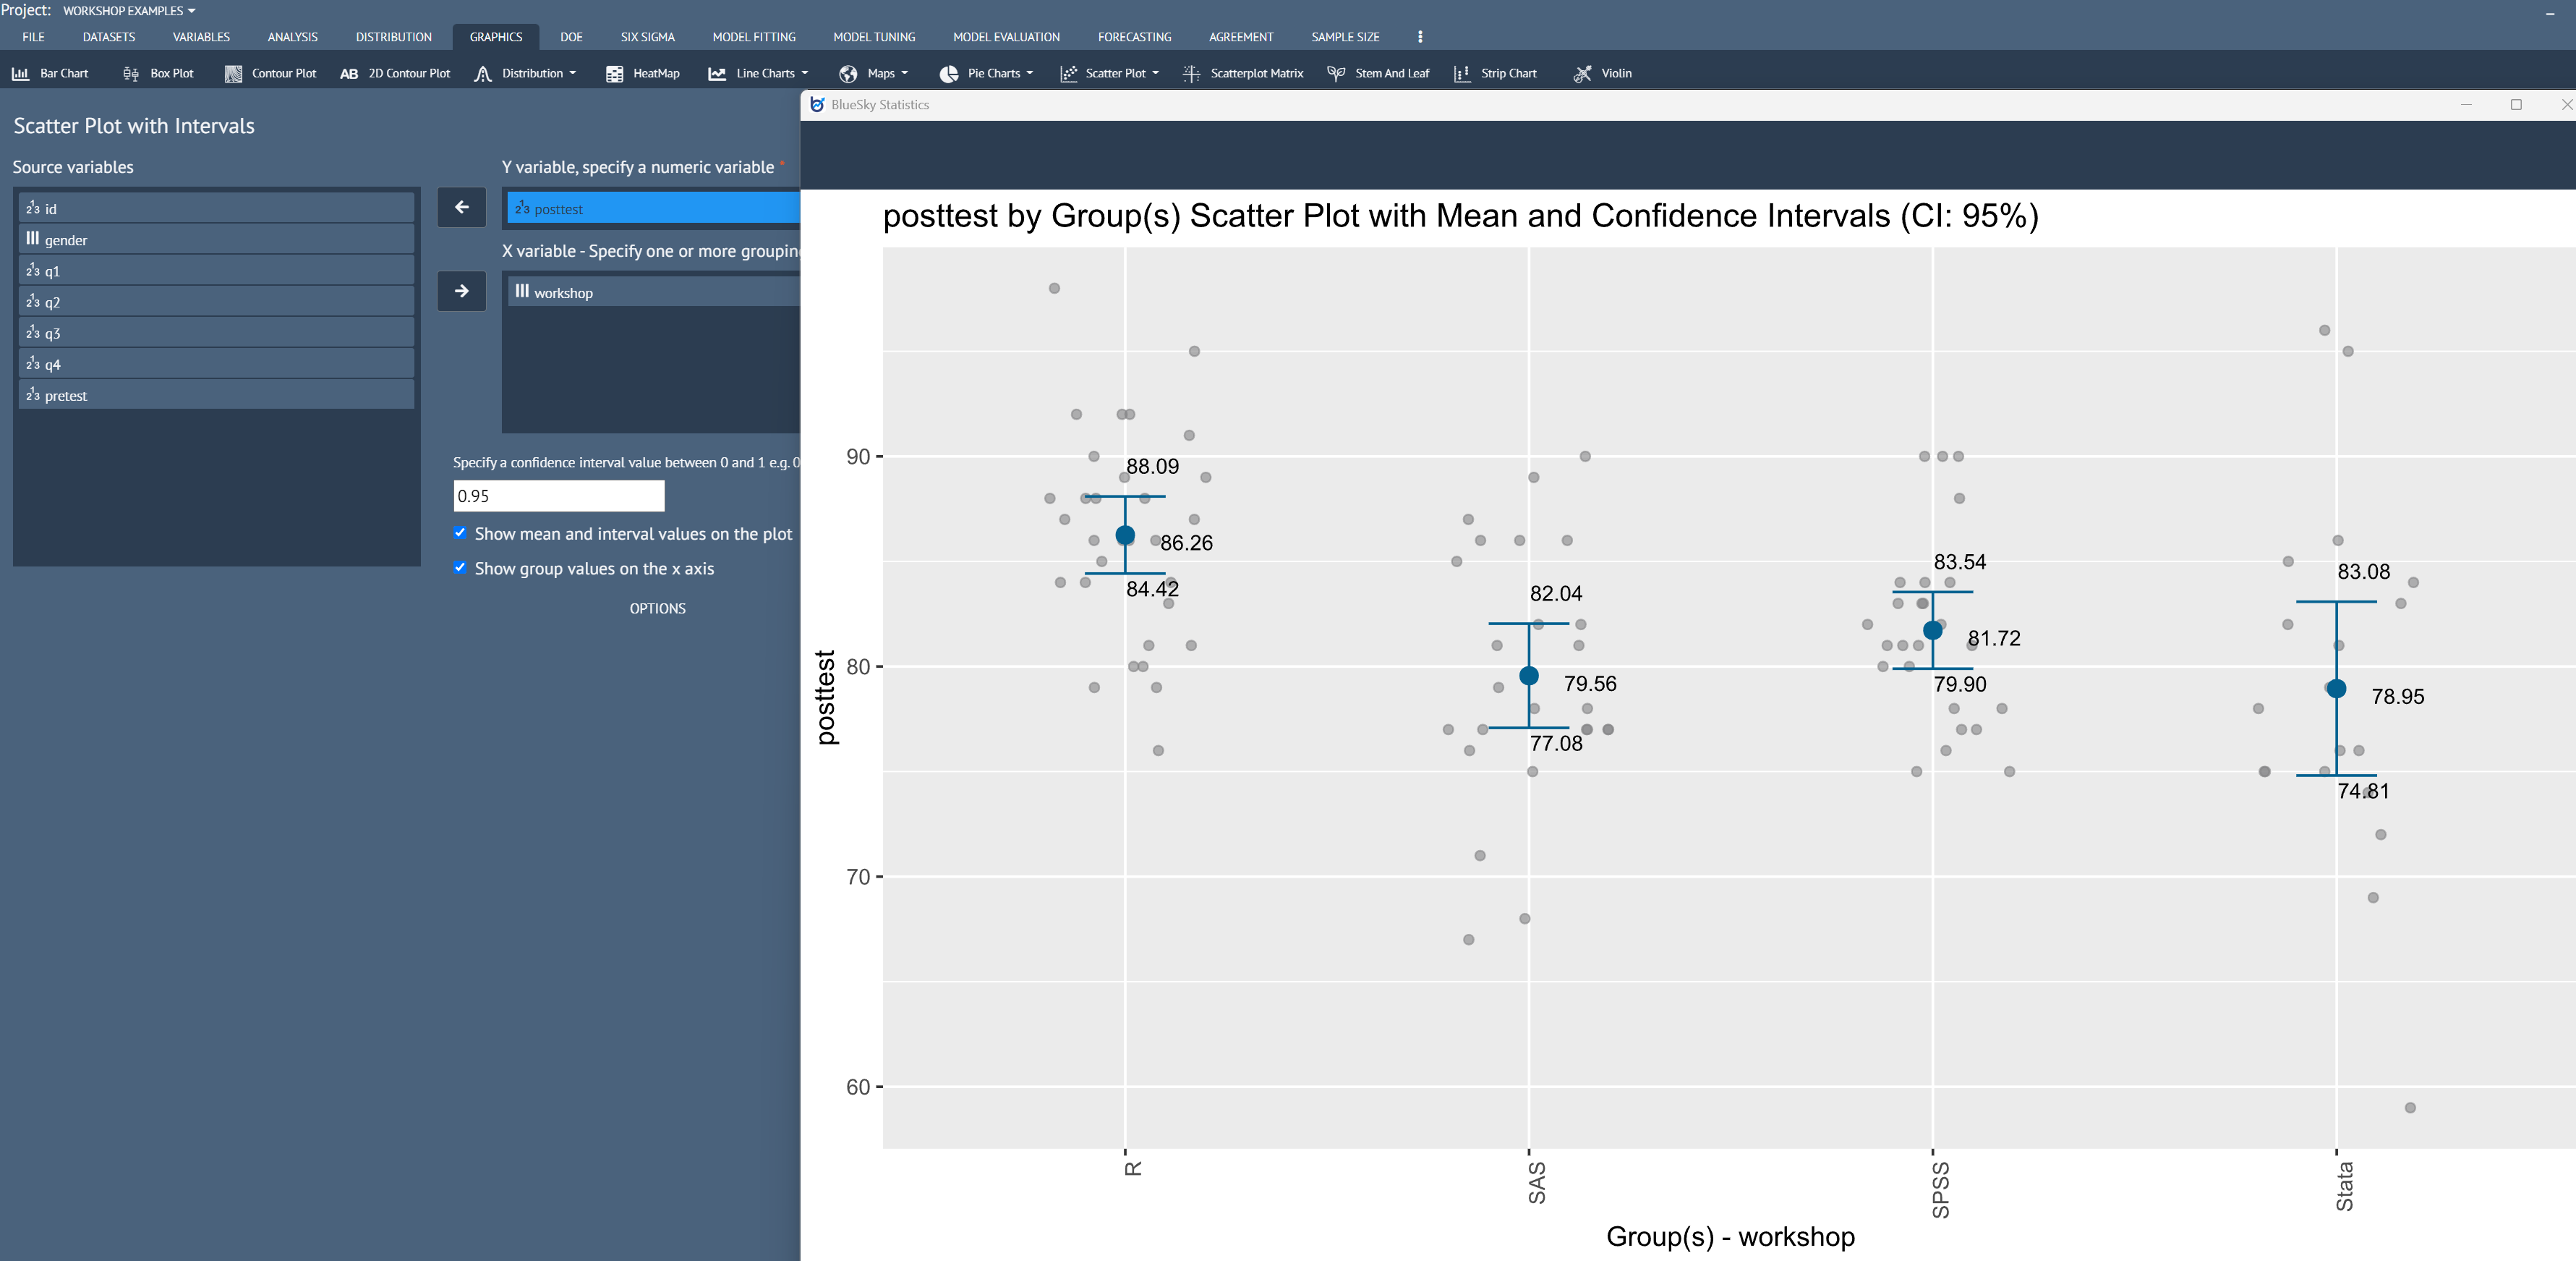
Scatterplot with mean and confidence interval bar
Graphics > Scatterplot > Scatter Plot with Intervals
A Scatter Plot dialog with mean and confidence interval bar has been made available with an unlimited number of grouping variables for the X-axis to group a numeric variable for the Y-axis.
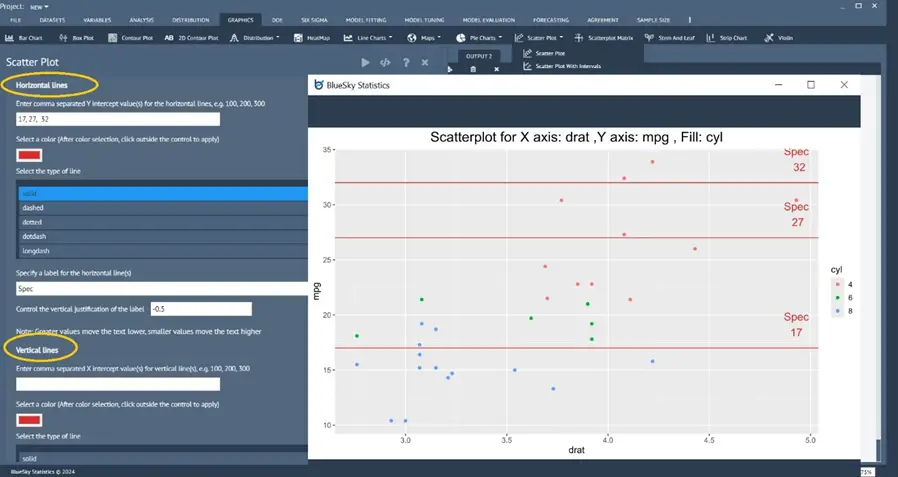
Enhanced Scatterplot with both horizontal and vertical reference lines
Graphics > Scatterplot > Scatter Plot Ref Lines
The Scatterplot dialog has been enhanced so that users can add an unlimited number of reference lines (horizontal and vertical axis) to the plot.
Enhancements to BlueSky Statistics R Editor and Output Syntax/Code Editor
For R-programmers many enhancements have been made to the BlueSky R Editor and the output syntax/code editor to improve ease of use and productivity with tooltips, find and replace, undo/redo, comment/uncomment blocks, etc.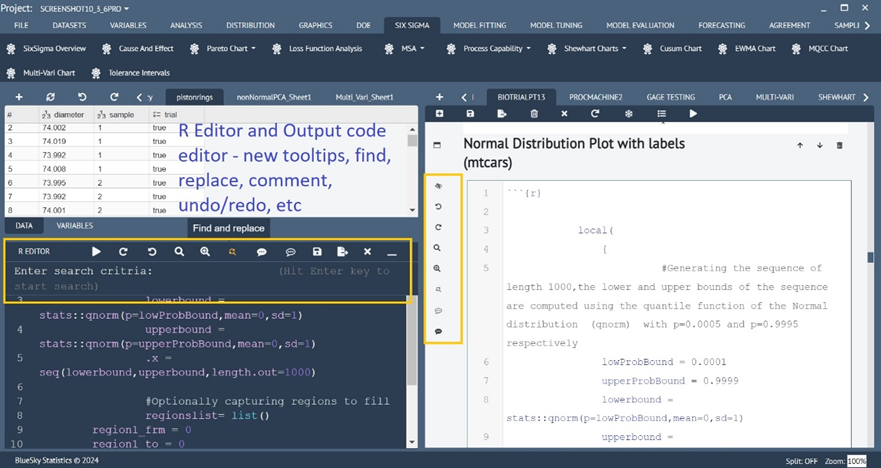
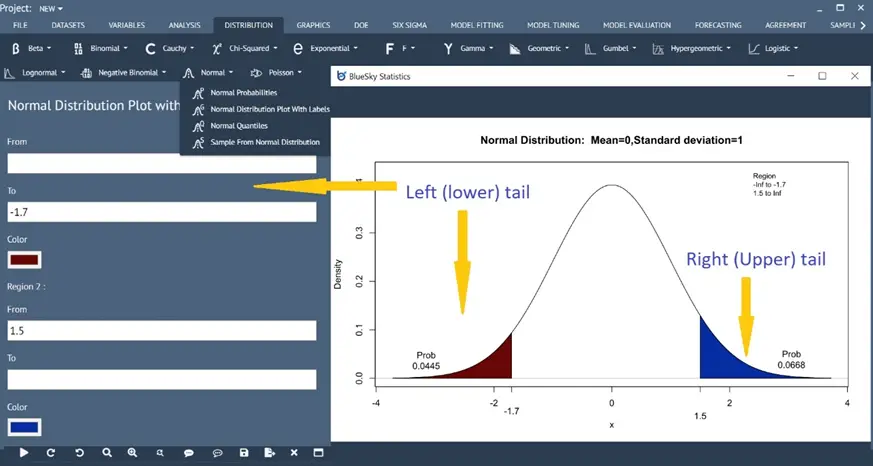
Enhanced Normal Distribution Plot
Distribution > Normal > Normal Distribution Plot with Labels
- The normal distribution plot will show the computed probability and x values on the plot for the shaded area for x value and quantiles, respectively
- Plot one tail (left and right), two tails, and other ranges
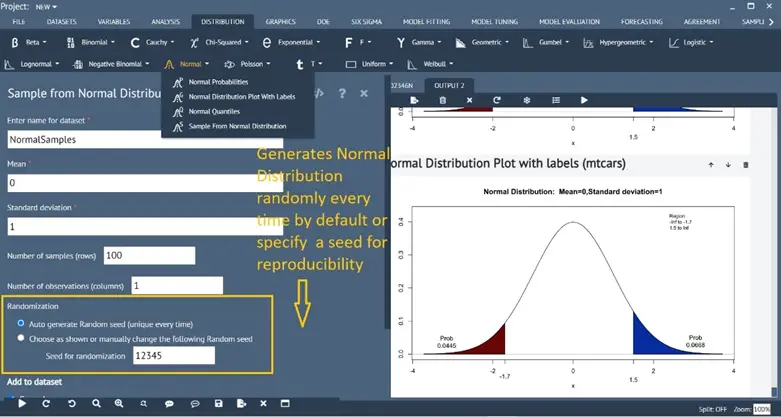
Automatic randomization of generating normal sample distribution
Distribution > Normal > Sample from Normal Distribution
In addition to setting a seed value for reproducibility, the default option has been set to randomize automatically the sample data generation every time.
Automatic randomization of design creations of all DoE designs
DOE > Create Design > ….
In addition to setting a seed value for reproducibility, the default option has been set to randomize the creation of any DoE design every time automatically.

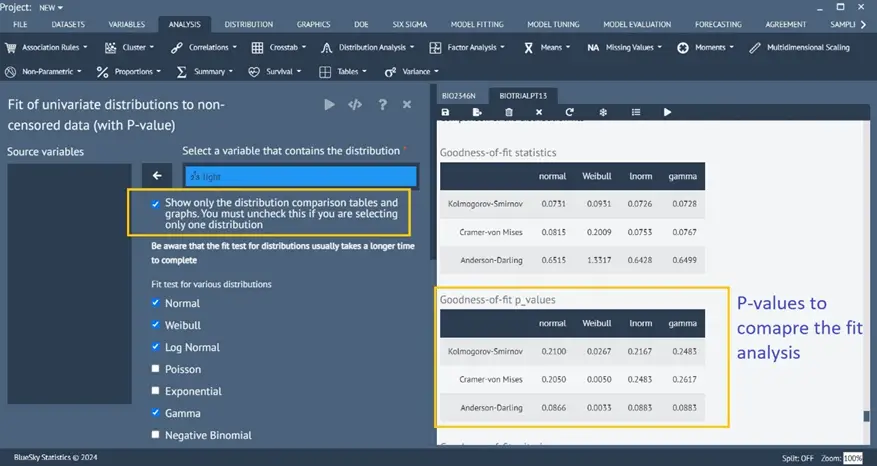
Enhanced Distribution Fit analysis
Analysis > Distribution Analysis > Distribution Fit P-value
The distribution fit analysis has been enhanced to compute AD, KS, and CVM tests and show test statistics, as well as corresponding p-values. These assist users in determining the best fit in addition to the existing AIC and BIC values.
Moreover, an option has been introduced for users to see only the comparison of distributions and skip displaying the analysis of the individual distribution fit analysis.
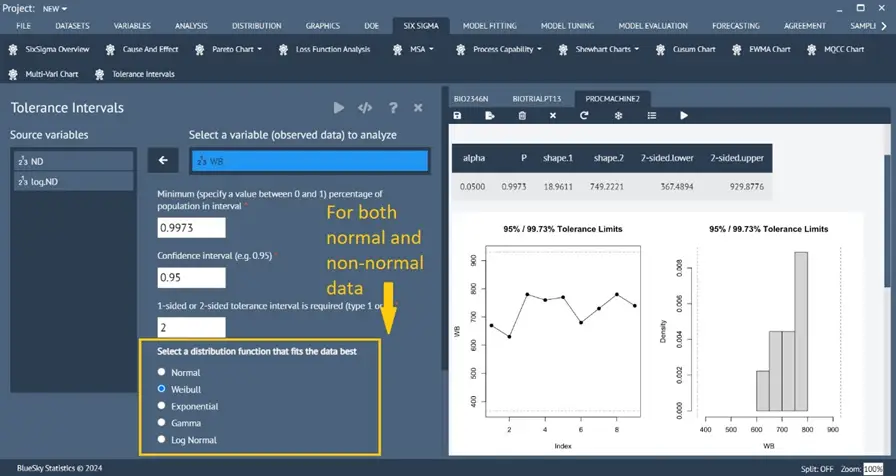
Tolerance Intervals
Six Sigma > Tolerance Intervals
A new Tolerance Intervals analysis has been introduced. The tolerance interval describes the range of values for a distribution with confidence limits calculated to a particular percentile of the distribution. These tolerance limits, taken from the estimated interval, are limits within which a stated proportion of the population is expected to occur.
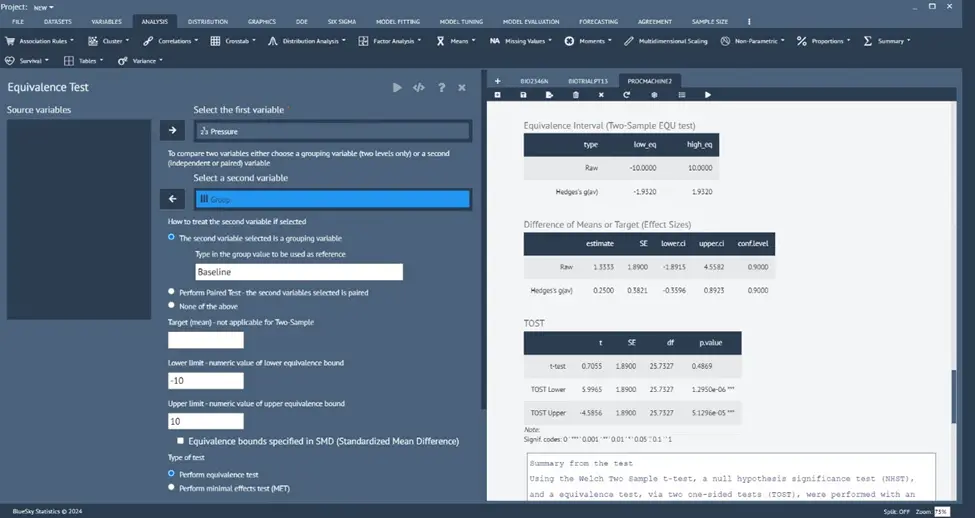
Equivalence (and Minimal Effect) test
Analysis > Means > Equivalence test
This new feature tests for mean equivalence and minimal effects.
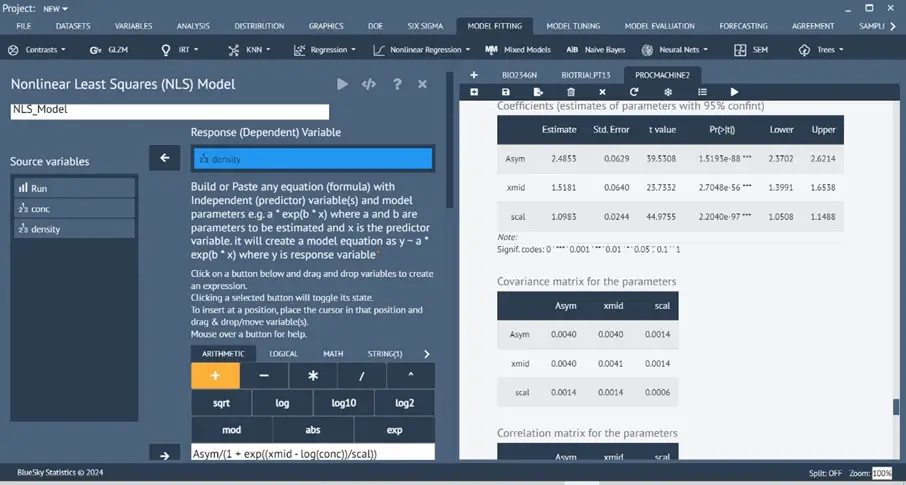
Nonlinear Least Square – all-purpose Non-Linear Regression modeling
Model Fitting > Nonlinear Least Square
Performs non-linear regression with flexibility and many user options to model, test, and plot.
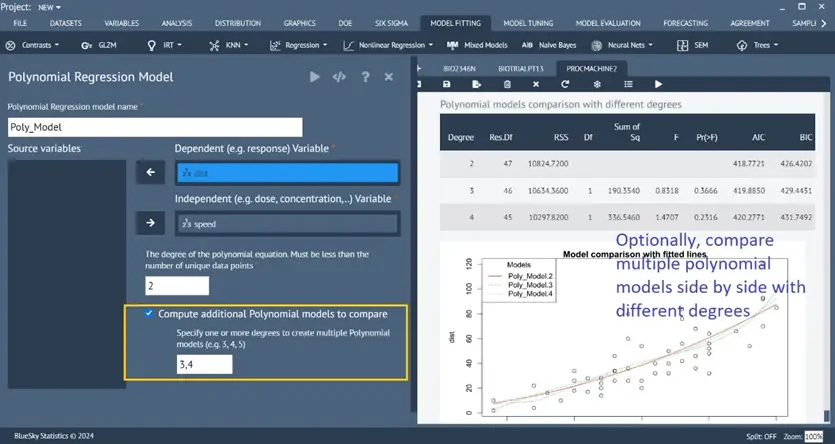
Polynomial Models with different degrees
Model Fitting > Polynomial
Computes and fits an orthogonal polynomial model with a specified degree. Also, optionally compares multiple Polynomial models of different degrees side by side.
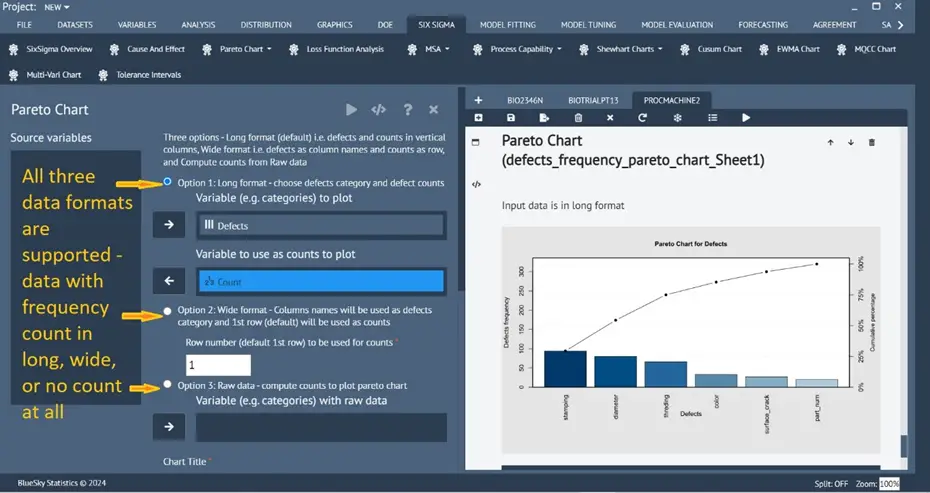
Enhanced Pareto Chart
Six Sigma > Pareto Chart > Pareto Chart
A new option has been added for data that does not have a count column but only has the raw data. Automatically computes cumulative frequency from Raw Data for plotting.
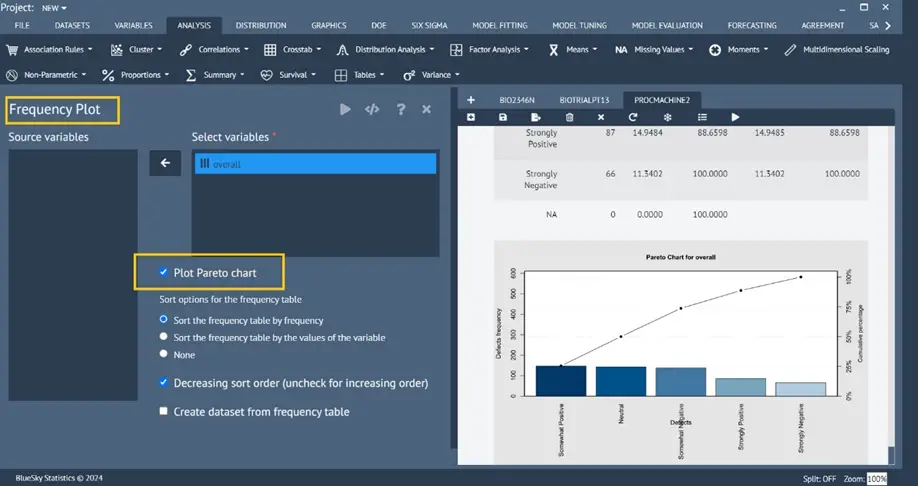
Frequency analysis with an option to draw a Pareto chart
Analysis > Summary > Frequency Plot
A new dialog has been introduced to plot (optionally) the Pareto Chart from the frequency table and, if desired, display the frequency table on the Datagrid.
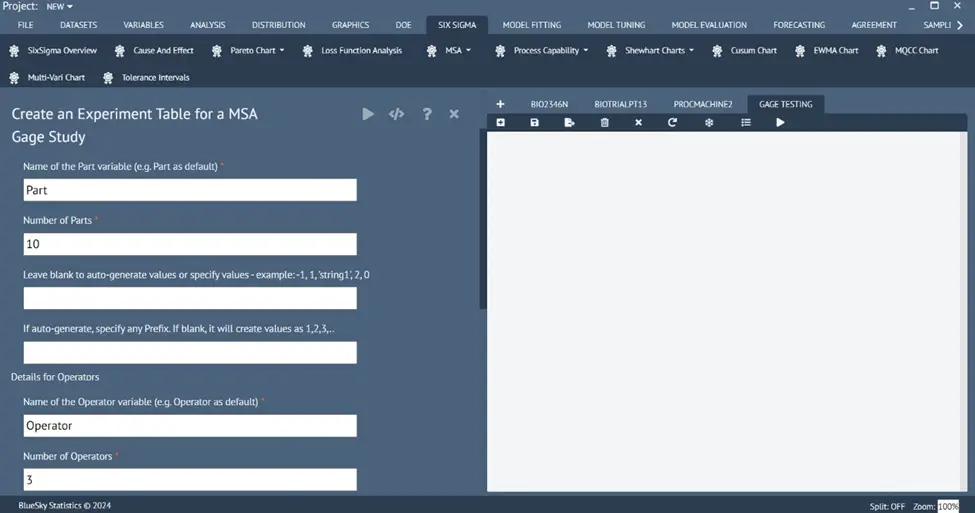
MSA (Measurement System Analysis) Enhancements
Gage Study Design Table
Six Sigma > MSA > Design MSA Study
Users can generate a randomized design experiment table for any combination of the number of operators, parts, and replications to set up a Gage study table to perform experiments and collect the results to analyze the accuracy of the Gage under study with analysis like Gage R&R, Gage Bias, etc.
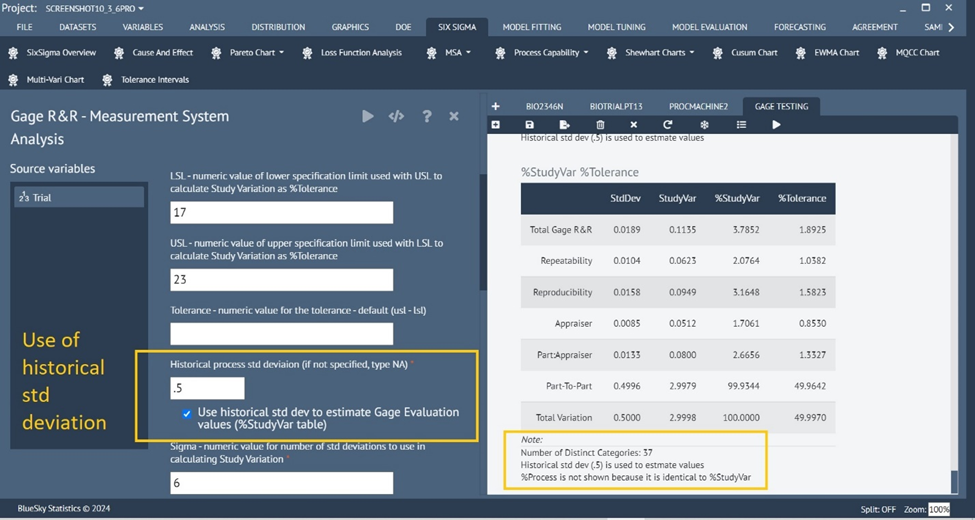
Enhanced Gage R&R
Six Sigma > MSA > Gage R&R
Many enhancements and options have been introduced to the Gage of R&R dialog and the underlying analysis
- Report header table
- Enlarged graphs
- Nested gage data analysis, in addition to crossed
- Usage of historical process std dev to estimate Gage Evaluation values (%StudyVar table)
- Show %Process
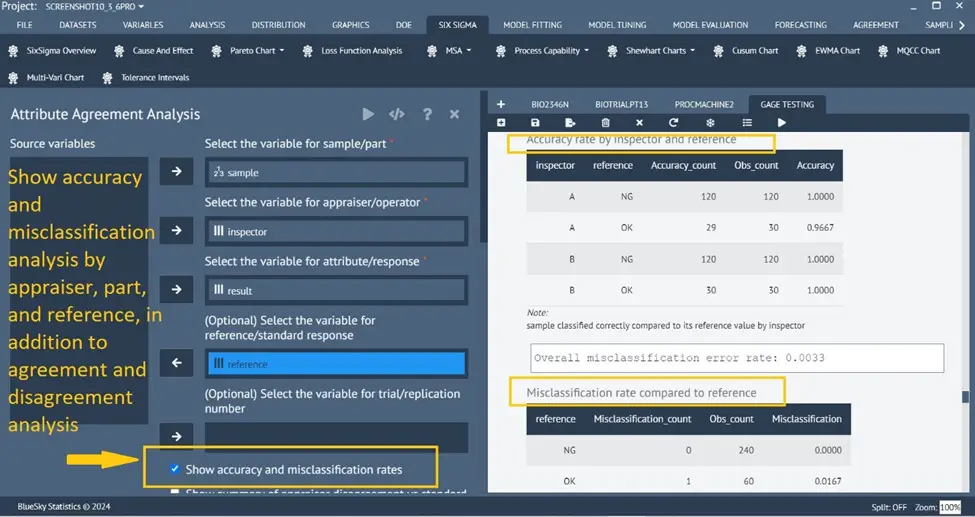
Enhanced Gage Attribute Analysis
Six Sigma > MSA > Attribute Analysis
Many enhancements and options have been introduced to the Attribute Analysis dialog and the underlying analysis
- Report header table
- Accuracy and classification rate calculations, in addition to agreement and disagreement
- Optional Cohen’s Kappa stats (between each pair of raters) in addition to Fleiss Kappa (multi-raters)
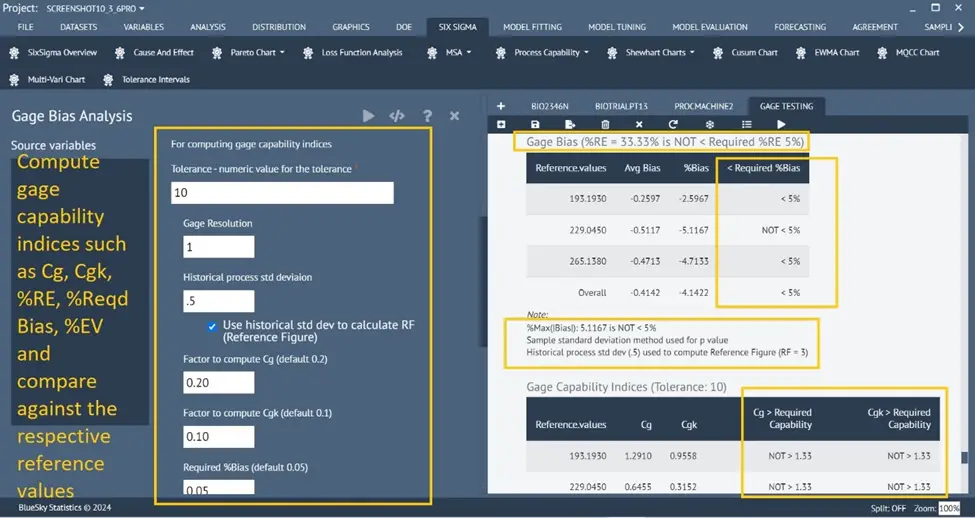
Enhanced Gage Bias Analysis
Six Sigma > MSA > Gage Bias Analysis
Many enhancements and options have been introduced to the Gage Bias Analysis dialog and the underlying analysis
- Efficient single dialog with options for linearity and type-1 tests for one or more References
- A new option – “Method to use for estimating repeatability std dev”
- Cg and Cgk – calculated for different Reference values in one go
- Run charts for every reference value and an overall run chart for all reference values
- Usage of historical std dev to calculate RF (Reference Figure)
- %RE, %EV are introduced, and all tables show how the computed values compared to the required/cut-off values specified by users on the dialog
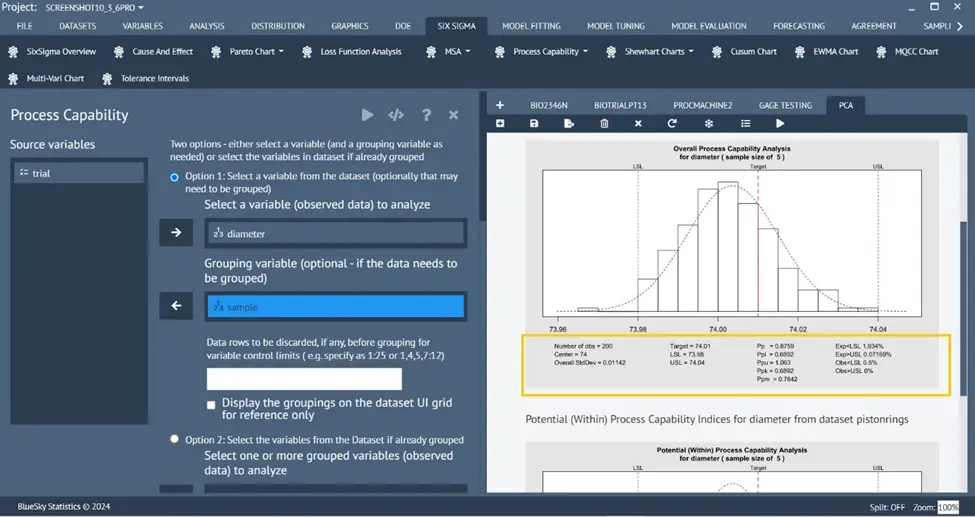
PCA (Process Capability Analysis) Enhancements
Enhanced Process Capability Analysis (for normal data)
Six Sigma > Process Capability > Process Capability
- pp_l = pp_k and ppU = ppk is shown when a one-sided tolerance is used
- Removed underscores to only show Ppl, Ppk, Ppu, Cp, Cpk, .. etc
- A new option – “Do not use unbiasing constant to estimate std dev for overall process capability indices” to compute overall Ppk (Ppl)
- Underlying charts (xbar.one) renamed to MR or I Chart based on SD or MR
- Handling of missing values
- Customizable number of decimals to show on the plot
- Standard Deviation label on the plot marked as “Overall StdDev” and “Within StdDev”
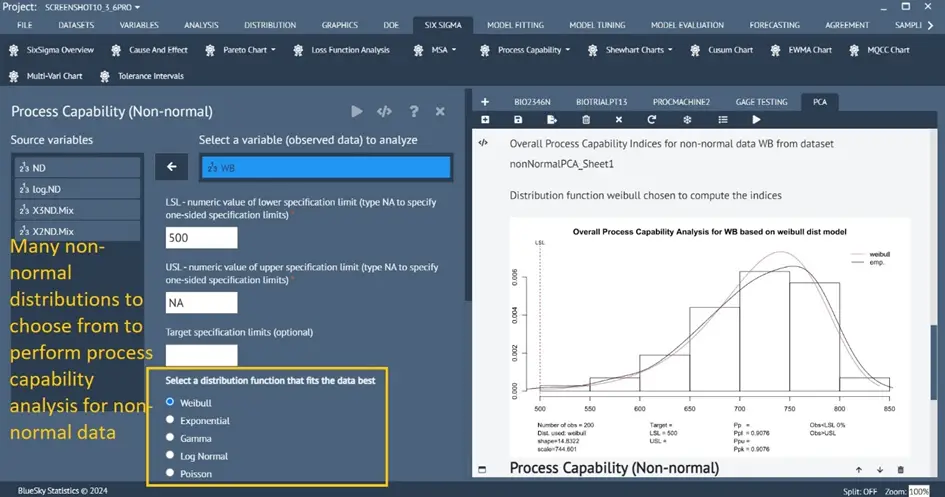
Process Capability Analysis for non-normal data
Six Sigma > Process Capability > Process Capability (Non-Normal)
A new dialog has been introduced to perform process capability analysis for non-normal data.
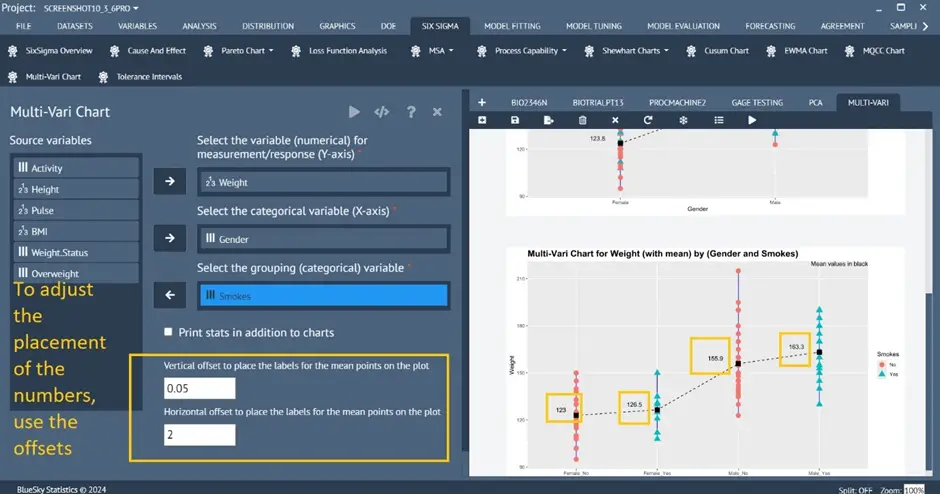
Multi-Vari graph
Six Sigma > Multi-Vari Chart
A new option has been added to adjust horizontal and vertical position offset to place/move the values for the data points on the plot.
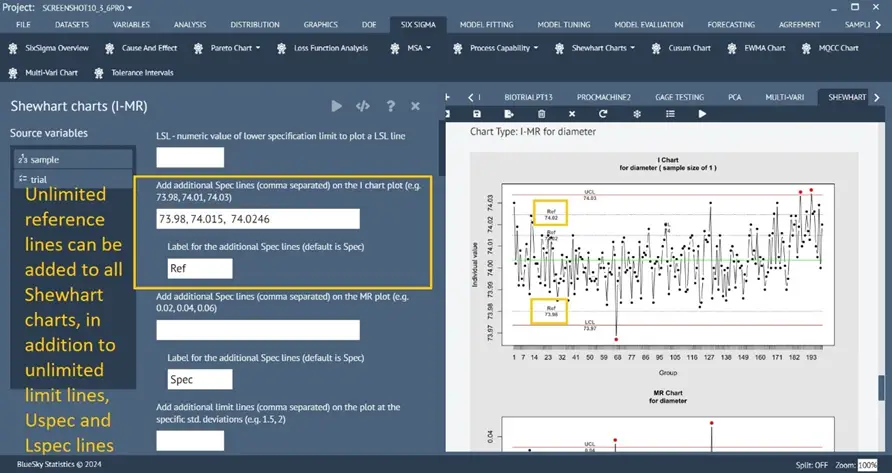
Enhanced Shewhart Charts
Six Sigma > Shewhart Charts > …….
A new option has been added to all Shewhart Charts dialogs: the ability to add any number of spec/reference lines to the chart specified by the user.