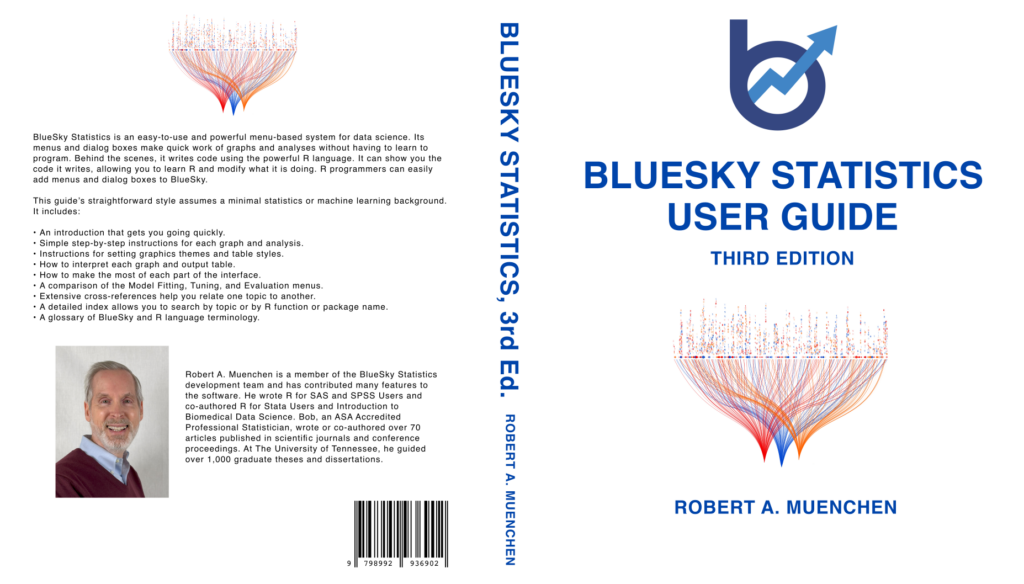
BlueSky Statistics LLC has published the third edition of the User Guide, written by yours truly. It is exclusively available for order here. The previous 6″x 9″ format would have run over 700 pages, so we switched to 8.5″x 11″ to reduce the page count to 533.

While this new edition is available only in print, the previous edition is still on the guide’s webpage. The PDF is not downloadable, as the advertising on that page helps support the considerable effort required to keep up with this rapidly expanding software.
My review of BlueSky Statistics is here, and a summary of how it compares to other R GUIs is here. New topics covered in the third edition include:
- Using the Table of Contents to skip around the Output window.
- Freezing table labels as contents scroll beneath them.
- Adding variable labels to all tabular results.
- Renaming output tabs.
- Using the Datagrid’s audit trail.
- Rerunning an entire workflow with a single click.
- Automating the replacement of datasets when rerunning a workflow.
- Using project files to save or load many files simultaneously.
- Cleaning Excel files to remove rows or columns and create multi-row variable names.
- Automating the extraction of repeating patterns of variables.
- Creating cumulative statistics variables.
- Separating delimited values stored in a character variable.
- Converting characters to dates using expanded and simplified formats.
- Reading date/time variables; adding times to dates.
- Filling missing values upward or downward (e.g., last observation carried forward).
- Creating scatterplot matrix displays.
- Creating dual-axis plots.
- Plotting dose-response curves.
- Using new main effects and interaction plots.
- Displaying forest plots.
- Using new confidence interval plots (better for many factors).
- Performing subject matching.
- Performing risk set matching.
- Comparing groups by competing risks.
- Testing for mean equivalence.
- Calculating concordance correlation coefficients for multiple raters.
- Calculating categorical agreement.
- Using the new polynomial regression dialog.
- Fitting nonlinear regression models.
- Testing confirmatory factor analysis.
- Performing structural equation modeling.
- Generating M by two tables for relative risks and odds ratios.
- Using the response optimizer for linear or response surface models.
Thanks to everyone who sent in suggestions to improve this edition!