by Robert A. Muenchen
Abstract
This article, formerly known as The Popularity of Data Analysis Software, presents various ways of measuring software popularity or market share for advanced analytics. Such software is also referred to as tools for data science, statistical analysis, machine learning, artificial intelligence, predictive analytics, and business analytics and is also a subset of business intelligence.
Updates: The most recent update was to the Scholarly Articles section on 06/06/2023. The Job Advertisement section was updated on 10/10/2022. Other sections date to 2019. I announce the updates to this article on Twitter: https://twitter.com/BobMuenchen
Introduction
When choosing a tool for data analysis, now more commonly referred to as analytics or data science, there are many factors to consider:
- Does it run natively on your computer?
- Does the software provide all the methods you need? If not, how extensible is it?
- Does its extensibility use its own unique language or an external one (e.g. Python, R) that is commonly accessible from many packages?
- Does it fully support the style (programming, menus and dialog boxes, or workflow diagrams) that you like?
- Are its visualization options (e.g., static vs. interactive) adequate for your problems?
- Does it provide output in the form you prefer (e.g., cut & paste into a word processor vs. LaTeX integration)?
- Does it handle large enough data sets?
- Do your colleagues use it so you can easily share data and programs?
- Can you afford it?
The popularity of a given piece of data science software is a composite measure that combines all of the above considerations in a single measure. Popular software meets the needs of many. If that popularity is growing, then the software is probably continuing to compete well. If not, perhaps newer software with less market share is worth considering.
There are many ways to measure popularity or market share, and each has advantages and disadvantages. In rough order of the quality of the data, these include:
- Job Advertisements
- Scholarly Articles
- Programming Popularity Measures
- Surveys of Use
- IT Research Firm Reports
- Software Rating Websites
- Books
- Blogs
- Discussion Forum Activity
- Sales & Downloads
- Competition Use
- Growth in Capability
Let’s examine each of them in turn.
Job Advertisements
One of the best ways to measure the popularity or market share of software for data science is to count the number of job advertisements highlighting knowledge of each as a requirement. Job ads are rich in information and are backed by money, so they are perhaps the best measure of how popular each software is now. Plots of change in job demand give us a good idea of what will become more popular in the future.
Indeed.com is the biggest job site in the U.S., making its collection of job ads the best around. As their co-founder and former CEO Paul Forster stated, Indeed.com includes “all the jobs from over 1,000 unique sources, comprising the major job boards – Monster, CareerBuilder, HotJobs, Craigslist – as well as hundreds of newspapers, associations, and company websites.” Indeed.com also has superb search capabilities.
Searching for jobs using Indeed.com is easy, but searching for software in a way that ensures fair comparisons across packages is challenging. Some software is used only for data science (e.g., scikit-learn, Apache Spark), while others are used in data science jobs and, more broadly, in report-writing jobs (e.g., SAS, Tableau). General-purpose languages (e.g., Python, C, Java) are heavily used in data science jobs, but the vast majority of jobs that require them have nothing to do with data science. To level the playing field, I developed a protocol to focus the search for each software within only jobs for data scientists. The details of this protocol are described in a separate article, How to Search for Data Science Jobs. All results in this section use those procedures to make the required queries.
I collected the job counts discussed in this section on October 5, 2022. To measure percent change, I compare that to data collected on May 27, 2019. One might think that a sample on a single day might not be very stable, but they are. Data collected in 2017 and 2014 using the same protocol correlated r=.94, p=.002. I occasionally double-check some counts a month or so later and always get similar figures.
The number of jobs covers a wide range from zero to 164,996, with a mean of 11,653.9 and a median of 845.0. The distribution is so skewed that placing them all on the same graph makes reading values difficult. Therefore, I split the graph into three, each with a different scale. A single plot with a logarithmic scale would be an alternative, but when I asked some mathematically astute people how various packages compared on such a plot, they were so far off that I dropped that approach.
Figure 1a shows the most popular tools, those with at least 10,000 jobs. SQL is in the lead with 164,996 jobs. SQL is not usually used for generating models, but it can apply them. It is worth including with job searches as it helps inform us of its value when seeking data science jobs. Next comes Python with 150,992 and Java with 113,944. Then comes a set from C++/C# at 48,555, slowly declining to Microsoft’s Power BI at 38,125. Tableau, one of Power BI’s major competitors, is in that set. Next comes R and SAS, both around 24K jobs, with R slightly in the lead. Finally, we see a set slowly declining from MATLAB at 17,736 to Scala at 11,473.
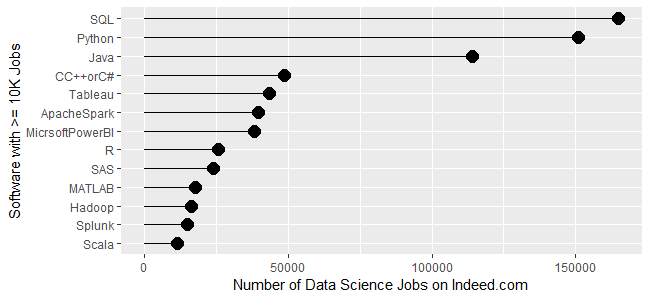
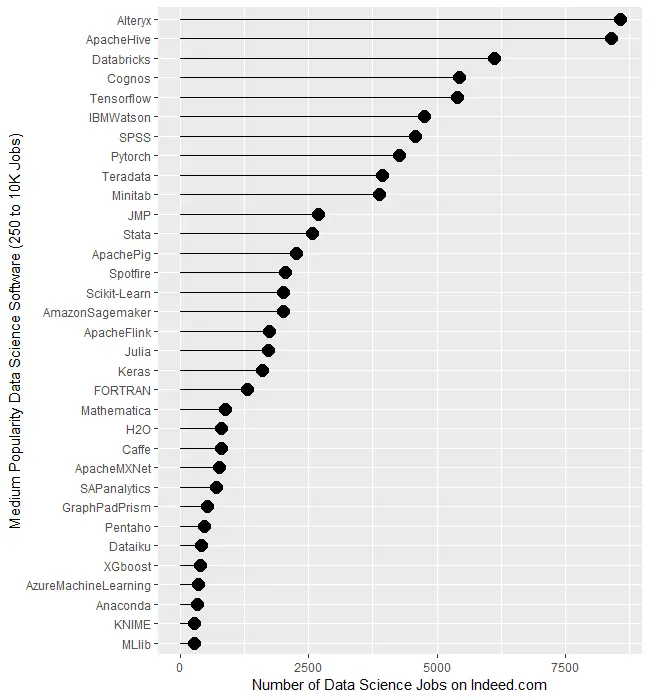
Figure 1b covers tools for which there are between 250 and 10,000 jobs. Alteryx and Apache Hive are at the top, both with around 8,400 jobs. There is quite a jump down to Databricks at 6,117, then much smaller drops from there to Minitab at 3,874. Then we see another big drop down to JMP at 2,693 after which things slowly decline until MLlib at 274.
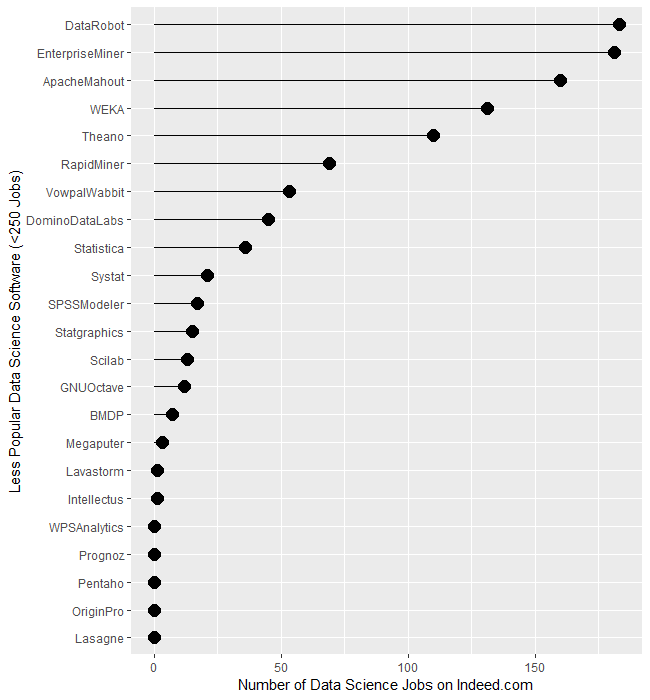
The least popular set of software, those with fewer than 250 jobs, are displayed in Figure 1c. It begins with DataRobot and SAS’ Enterprise Miner, both near 182. That’s followed by Apache Mahout with 160, WEKA with 131, and Theano at 110. From RapidMiner on down, there is a slow decline until we finally hit zero at Lasagne.
Several tools use the powerful yet easy workflow interface: Alteryx, KNIME, Enterprise Miner, RapidMiner, and SPSS Modeler. The scale of their counts is too broad to make a decent graph, so I have compiled those values in Table 1. There we see Alteryx is exceptionally dominant, with 30 times as many jobs as its closest competitor, KNIME. The latter is around 50% greater than Enterprise Miner, while RapidMiner and SPSS Modeler are tiny by comparison.
| Software | Jobs |
| Alteryx | 8,566 |
| KNIME | 281 |
| Enterprise Miner | 181 |
| RapidMiner | 69 |
| SPSS Modeler | 17 |
Let’s take a similar look at packages whose traditional focus was on statistical analysis. They have all added machine learning and artificial intelligence methods, but their reputation still lies mainly in statistics. We saw previously that when we consider the entire range of data science jobs, R was slightly ahead of SAS. Table 2 shows jobs with only the term “statistician” in their description. There we see that SAS comes out on top, though with such a tiny margin over R that you might see the reverse depending on the day you gather new data. Both are over five times as popular as Stata or SPSS and ten times as popular as JMP. Minitab seems to be the only remaining contender in this arena.
| Software | Jobs only for “Statistician” |
| SAS | 1040 |
| R | 1012 |
| Stata | 176 |
| SPSS | 146 |
| JMP | 93 |
| Minitab | 55 |
| Statistica | 2 |
| BMDP | 3 |
| Systat | 0 |
| NCSS | 0 |
Next, let’s look at the change in jobs from the 2019 data to now (October 2022), focusing on software that had at least 50 job listings back in 2019. Without such a limitation, software that increased from 1 job in 2019 to 5 jobs in 2022 would have a 500% increase but still would be of little interest. Percent change ranged from -64.0% to 2,479.9%, with a mean of 306.3 and a median of 213.6. There were two extreme outliers, IBM Watson, with job growth of 2,480%, and Databricks, at 1,323%. Those two were so much greater than the rest that I left them off of Figure 1d to keep them from compressing the remaining values beyond legibility. The rapid growth of Databricks has been noted elsewhere. However, I would take IBM Watson’s figure with a grain of salt as its growth in revenue seems nowhere near what Indeed.com’s job figure seems to indicate.
The remaining software is shown in Figure 1d, where those whose job market is “heating up” or growing are shown in red, while those that are cooling down are shown in blue. The main takeaway from this figure is that nearly the entire data science software market has grown over the last 3.5 years. At the top, we see Alteryx, with a growth of 850.7%. Splunk (702.6%) and Julia (686.2%) follow. To my surprise, FORTRAN follows, having gone from 195 jobs to 1,318, yielding growth of 575.9%! My supercomputing colleagues assure me that FORTRAN is still important in their area, but HPC is certainly not growing at that rate. If any readers have ideas on why this could occur, please leave your thoughts in the comments section below.
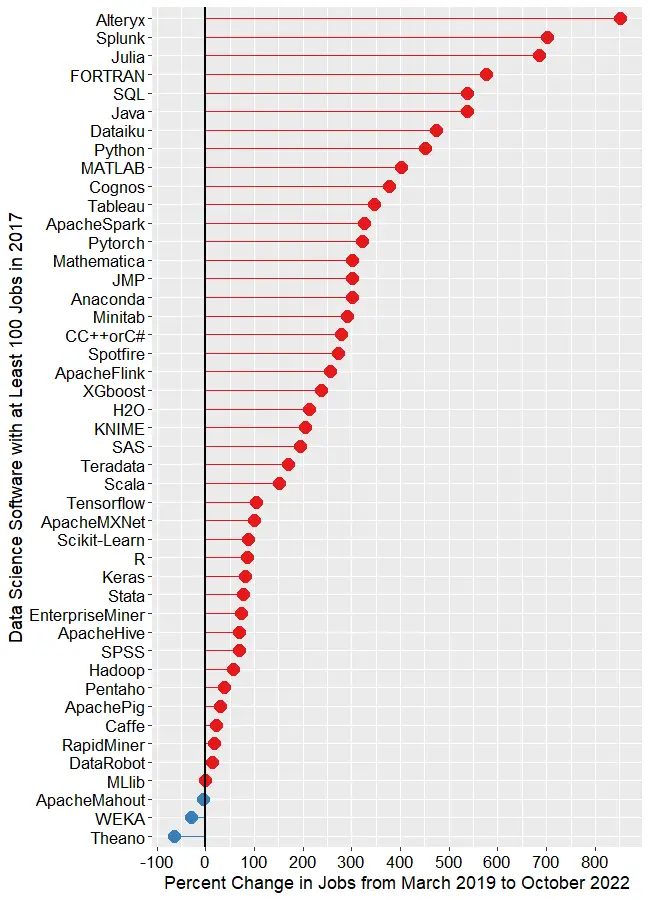
SQL and Java are both growing at around 537%. From Dataiku on down, the rate of growth slows steadily until we reach MLlib, which saw almost no change. Only two packages declined in job advertisements, with WEKA at -29.9% and Theano at -64.1%.
Scholarly Articles
Scholarly articles provide a rich source of information about data science tools. Because publishing requires significant effort, analyzing the type of data science tools used in scholarly articles provides a better picture of their popularity than a simple survey of tool usage. The more popular a software package is, the more likely it will appear in scholarly publications as an analysis tool or even as an object of study.
Since scholarly articles tend to use cutting-edge methods, the software used in them can be a leading indicator of where the overall market of data science software is headed. Google Scholar offers a way to measure such activity. However, no search of this magnitude is perfect; each will include some irrelevant articles and reject some relevant ones. The details of the search terms I used are complex enough to move to a companion article, How to Search For Data Science Articles.
Figure 2a shows the number of articles found for the more popular software packages and languages (those with at least 4,500 articles) in the most recent complete year, 2022.
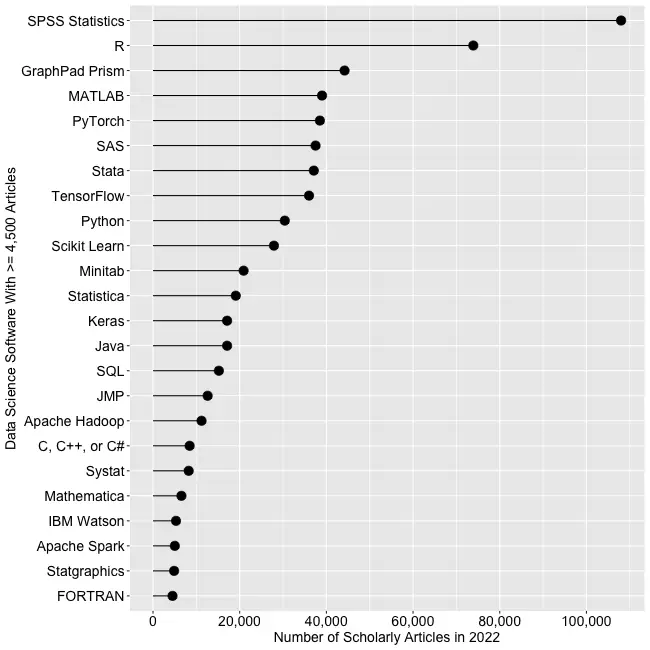
SPSS is the most popular package, as it has been for over 20 years. This may be due to its balance between power and its graphical user interface’s (GUI) ease of use. R is in second place with around two-thirds as many articles. It offers extreme power, but as with all languages, it requires memorizing and typing code. GraphPad Prism, another GUI-driven package, is in third place. The packages from MATLAB through TensorFlow are roughly at the same level. Next comes Python and Scikit Learn. The latter is a library for Python, so there is likely much overlap between those two. Note that the general-purpose languages: C, C++, C#, FORTRAN, Java, MATLAB, and Python are included only when found in combination with data science terms, so view those counts as more of an approximation than the rest. Old stalwart FORTRAN appears last in this plot. While its count seems close to zero, that’s due to the wide range of this scale, and its count is just over the 4,500-article cutoff for this plot.
Continuing on this scale would make the remaining packages appear too close to the y-axis to read, so Figure 2b shows the remaining software on a much smaller scale, with the y-axis going to only 4,500 rather than the 110,000 used in Figure 2a. I chose that cutoff value because it allows us to see two related sets of tools on the same plot: workflow tools and menu/dialog-box GUIs for the R language that makes them work much like SPSS.

JASP and jamovi are both front-ends to the R language and are way out front in this category. The next R GUI is R Commander, with half as many citations. Still, that’s far more than the rest of the R GUIs: BlueSky Statistics, Rattle, RKWard, R-Instat, and R AnalyticFlow. While many of these have low counts, we’ll soon see that the use of nearly all is rapidly growing.
Workflow tools are controlled by drawing 2-dimensional flowcharts that direct the flow of data and models through the analysis process. That approach is slightly more complex to learn than SPSS’ simple menus and dialog boxes, but it gets closer to the complete flexibility of code. In order of citation count, these include RapidMiner, KNIME, Orange Data Mining, IBM SPSS Modeler, SAS Enterprise Miner, Alteryx, and R AnalyticFlow. From RapidMiner to KNIME, to SPSS Modeler, the citation rate approximately cuts in half each time. Orange Data Mining comes next, at around 30% less. KNIME, Orange, and R Analytic Flow are all free and open-source.
While Figures 2a and 2b help study market share now, they don’t show how things are changing. It would be ideal to have long-term growth trend graphs for each software, but collecting that much data is too time-consuming. Instead, I’ve collected data only for the years 2019 and 2022. This provides the data needed to study growth over that period.
Figure 2c shows the percent change across those years, with the growing “hot” packages shown in red (right side) and the declining or “cooling” ones shown in blue (left side).
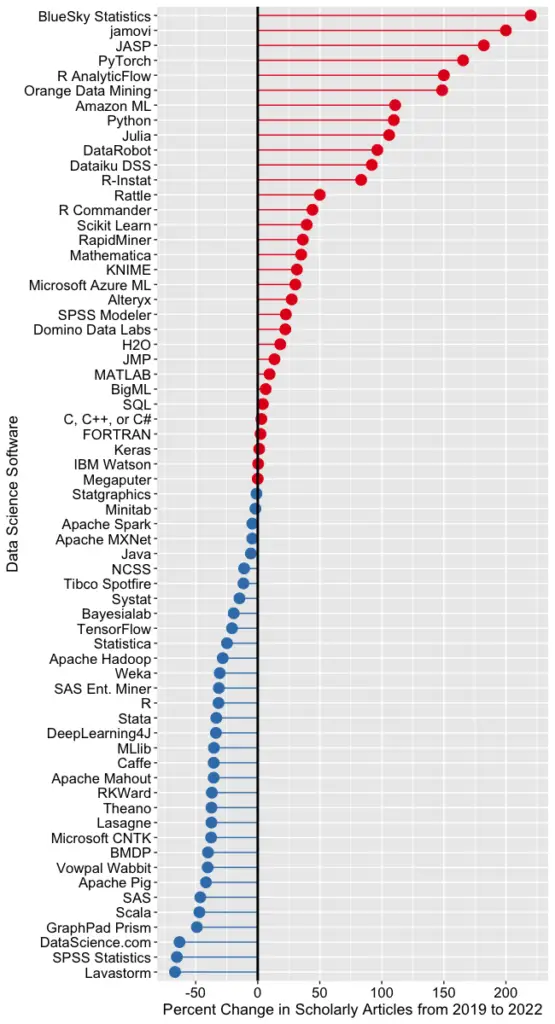
Seven of the 14 fastest-growing packages are GUI front-ends that make R easy to use. BlueSky’s actual percent growth was 2,960%, which I recoded as 220% as the original value made the rest of the plot unreadable. In 2022 the company released a Mac version, and the Mayo Clinic announced its migration from JMP to BlueSky; both likely had an impact. Similarly, jamovi’s actual growth was 452%, which I recoded to 200. One of the reasons the R GUIs were able to obtain such high percentages of change is that they were all starting from low numbers compared to most of the other software. So be sure to look at the raw counts in Figure 2b to see the raw counts for all the R GUIs.
The most impressive point on this plot is the one for PyTorch. Back on 2a we see that PyTorch was the fifth most popular tool for data science. Here we see it’s also the third fastest growing. Being big and growing fast is quite an achievement!
Of the workflow-based tools, Orange Data Mining is growing the fastest. There is a good chance that the next time I collect this data Orange will surpass SPSS Modeler.
The big losers in Figure 2c are the expensive proprietary tools: SPSS, GraphPad Prism, SAS, BMDP, Stata, Statistica, and Systat. However, open-source R is also declining, perhaps a victim of Python’s rising popularity.
I’m particularly interested in the long-term trends of the classic statistics packages. So in Figure 2d, I have plotted the same scholarly-use data for 1995 through 2016.

SPSS has a clear lead overall, but now you can see that its dominance peaked in 2009, and its use is in sharp decline. SAS never came close to SPSS’s level of dominance, and its usage peaked around 2010. GraphPad Prism followed a similar pattern, though it peaked a bit later, around 2013.
In Figure 2d, the extreme dominance of SPSS makes it hard to see long-term trends in the other software. To address this problem, I have removed SPSS and all the data from SAS except for 2014 and 2015. The result is shown in Figure 2e.

Figure 2e shows that most of the remaining packages grew steadily across the time period shown. R and Stata grew especially fast, as did Prism until 2012. The decline in the number of articles that used SPSS, SAS, or Prism is not balanced by the increase in the other software shown in this graph.
These results apply to scholarly articles in general. The results in specific fields or journals are likely to differ.
Programming Popularity Websites
Several websites rank the popularity of programming languages. Unfortunately, they don’t differentiate between general-purpose languages and application-specific ones used for analytics. However, it’s easy to choose the few analytics languages for their results.
The most comprehensive of these sites is the IEEE Spectrum Ranking. This site combines 12 metrics from 10 different sites. These include measures discussed, such as popularity on job sites and search engines. They also include fascinating and useful objective measures, such as how much new programming code was added to the popular GitHub repository last year. Figure 3a shows their rankings for the most recent complete year, 2022:
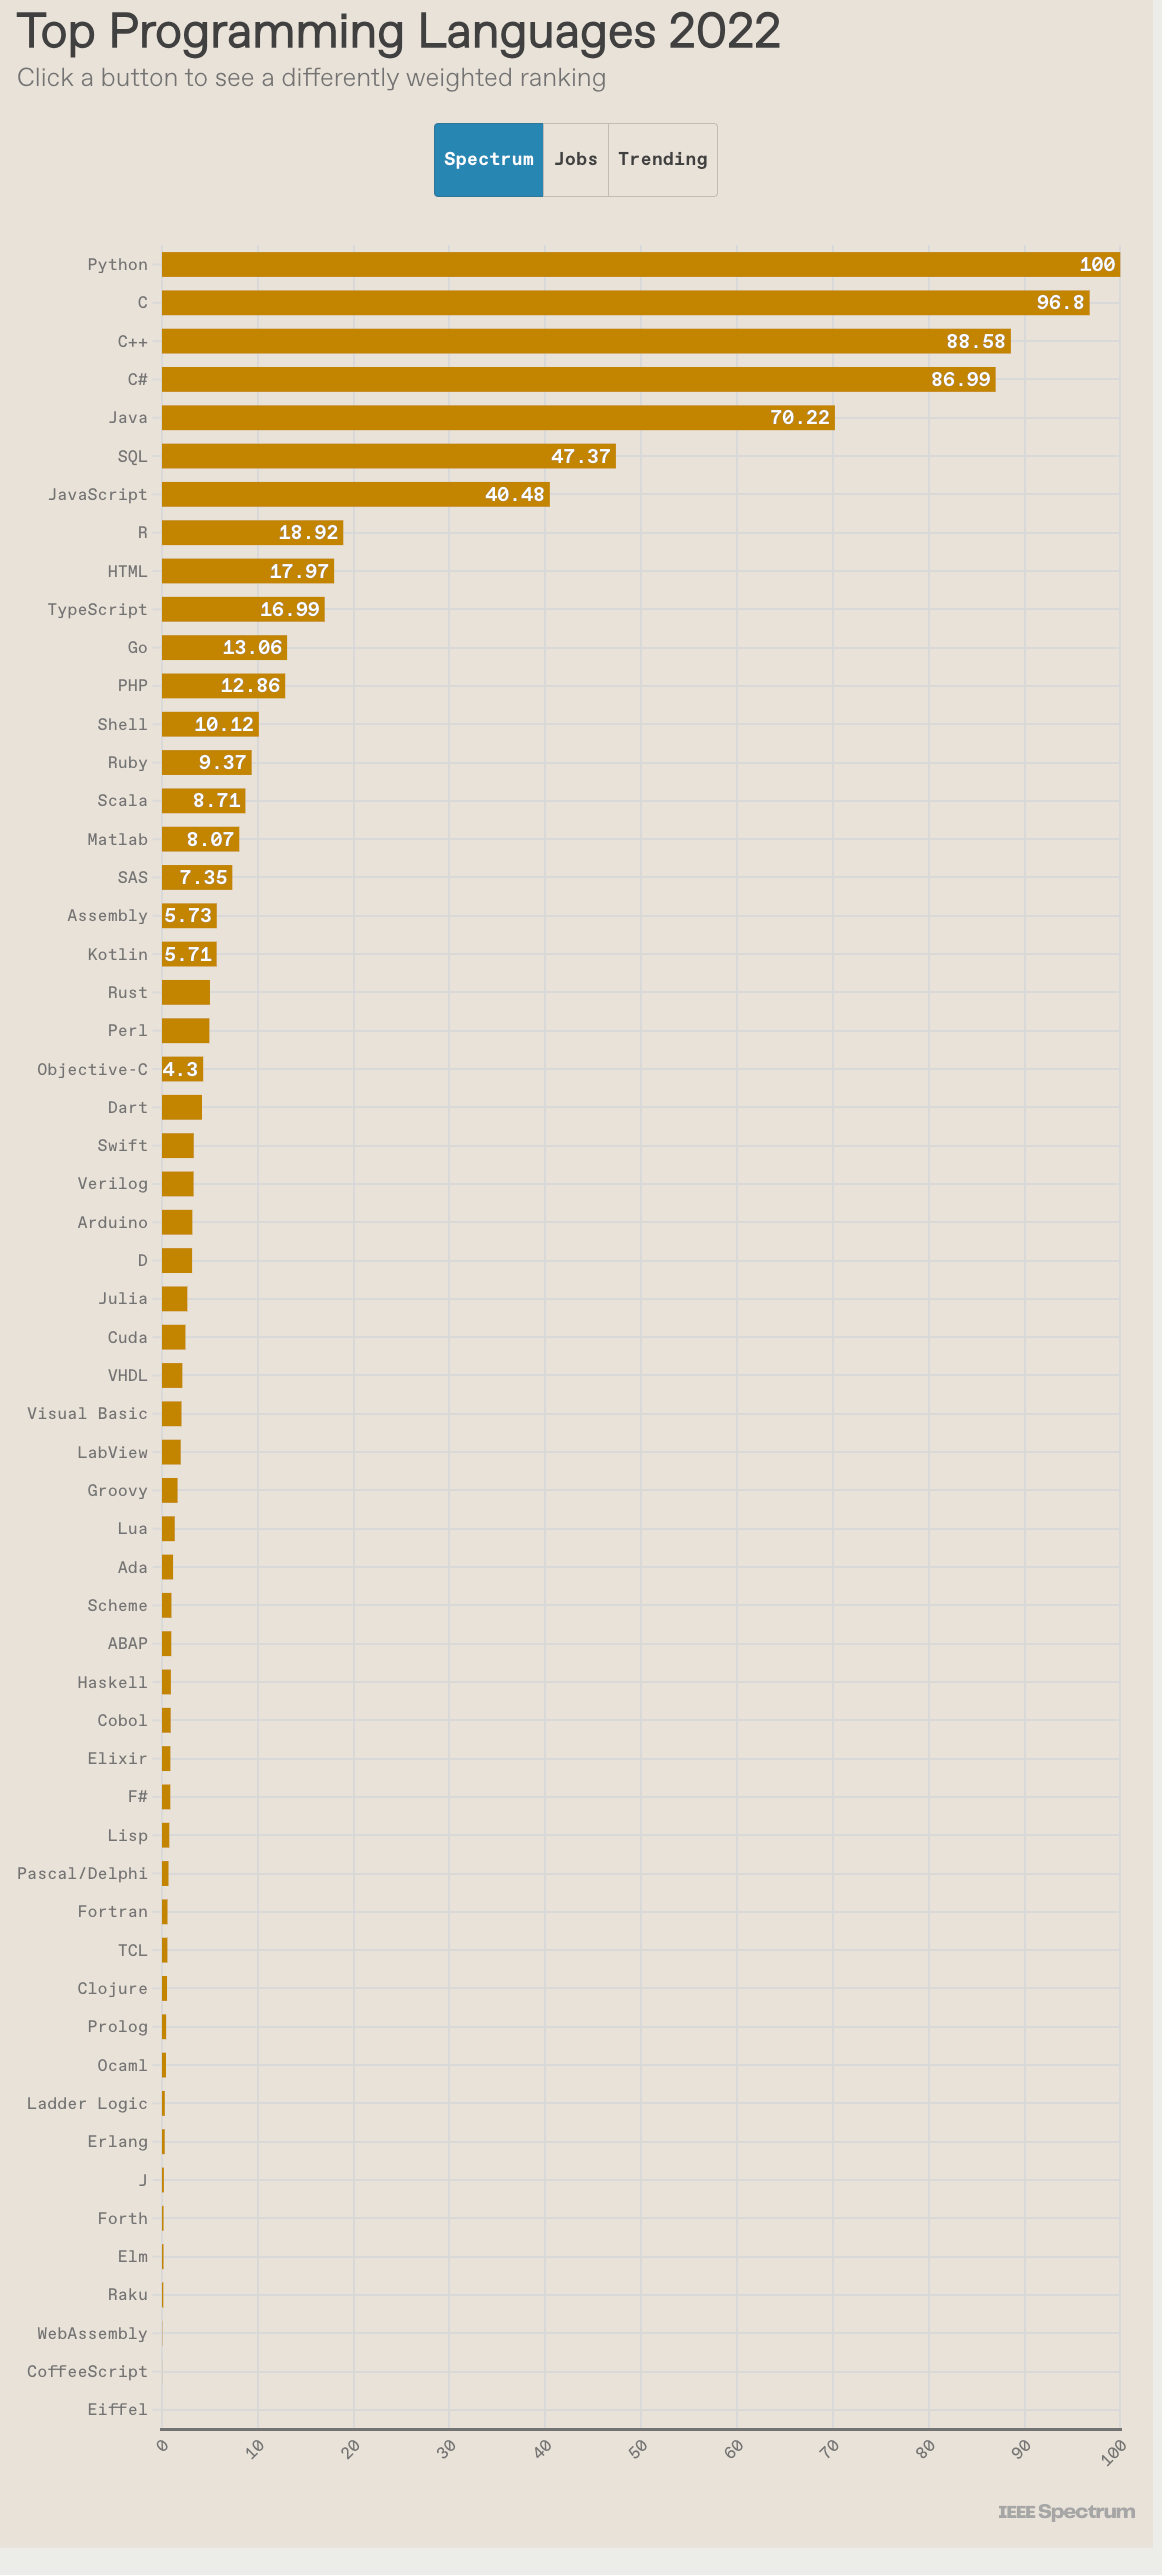
While Python is #1 and R is #8, it’s important to remember that Python is used for many other tasks than data science! SAS and MATLAB are #16 and #17, respectively. Julia is much farther down the list at #28. At the top of the plot is a button that lets you change the ranking to focus on jobs or on trends. You have to go to the website to activate those. Remember that their job rating is for all jobs, while my data is only for data science jobs.
Redmonk is another site that ranks the general popularity of programming languages. Figure 3b shows their plot for the first quarter of 2023 (they update these quarterly). It plots the number of projects using each language in the popular Github repository against the number of tagged comments on the discussion forum StackOverflow.com. To appear on this plot, the language must be present in both websites.
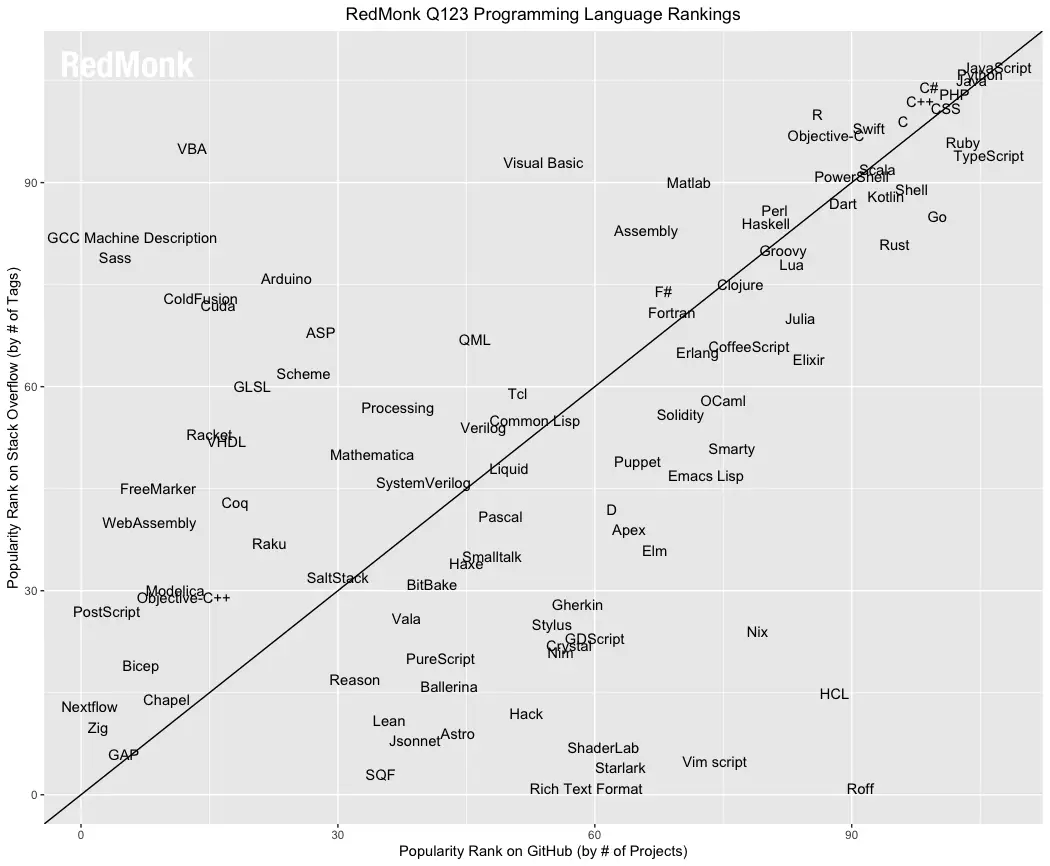
We can see that Redmonk’s approach places Python at #2 and at around R at around #12. MATLAB and Julia appear to fall on the diagonal line at about the same place.
The TIOBE Index also ranks the popularity of programming languages. It extracts measurements from 25 popular search engines, including Google, Bing, YouTube, Wikipedia, and Amazon.com, and combines their results into a single index. In their July 2023 index, they place Python #1, MATLAB #10 and R at #19. Julia and SAS are at #24 and #25 respectively. With monthly updates, TIOBE is the most current. However, there is an important limitation of the Tiobe Index: it searches for one single string: “X programming.” So if it didn’t find “SPSS programming,” then it doesn’t count. The complex searches I used for jobs and scholarly articles were far more helpful in estimating each package’s popularity. Another limitation of the Tiobe index is that it measures what is on the Internet now, so it’s a lagging indicator. There’s no way to plot trends without purchasing their data, which is quite expensive.
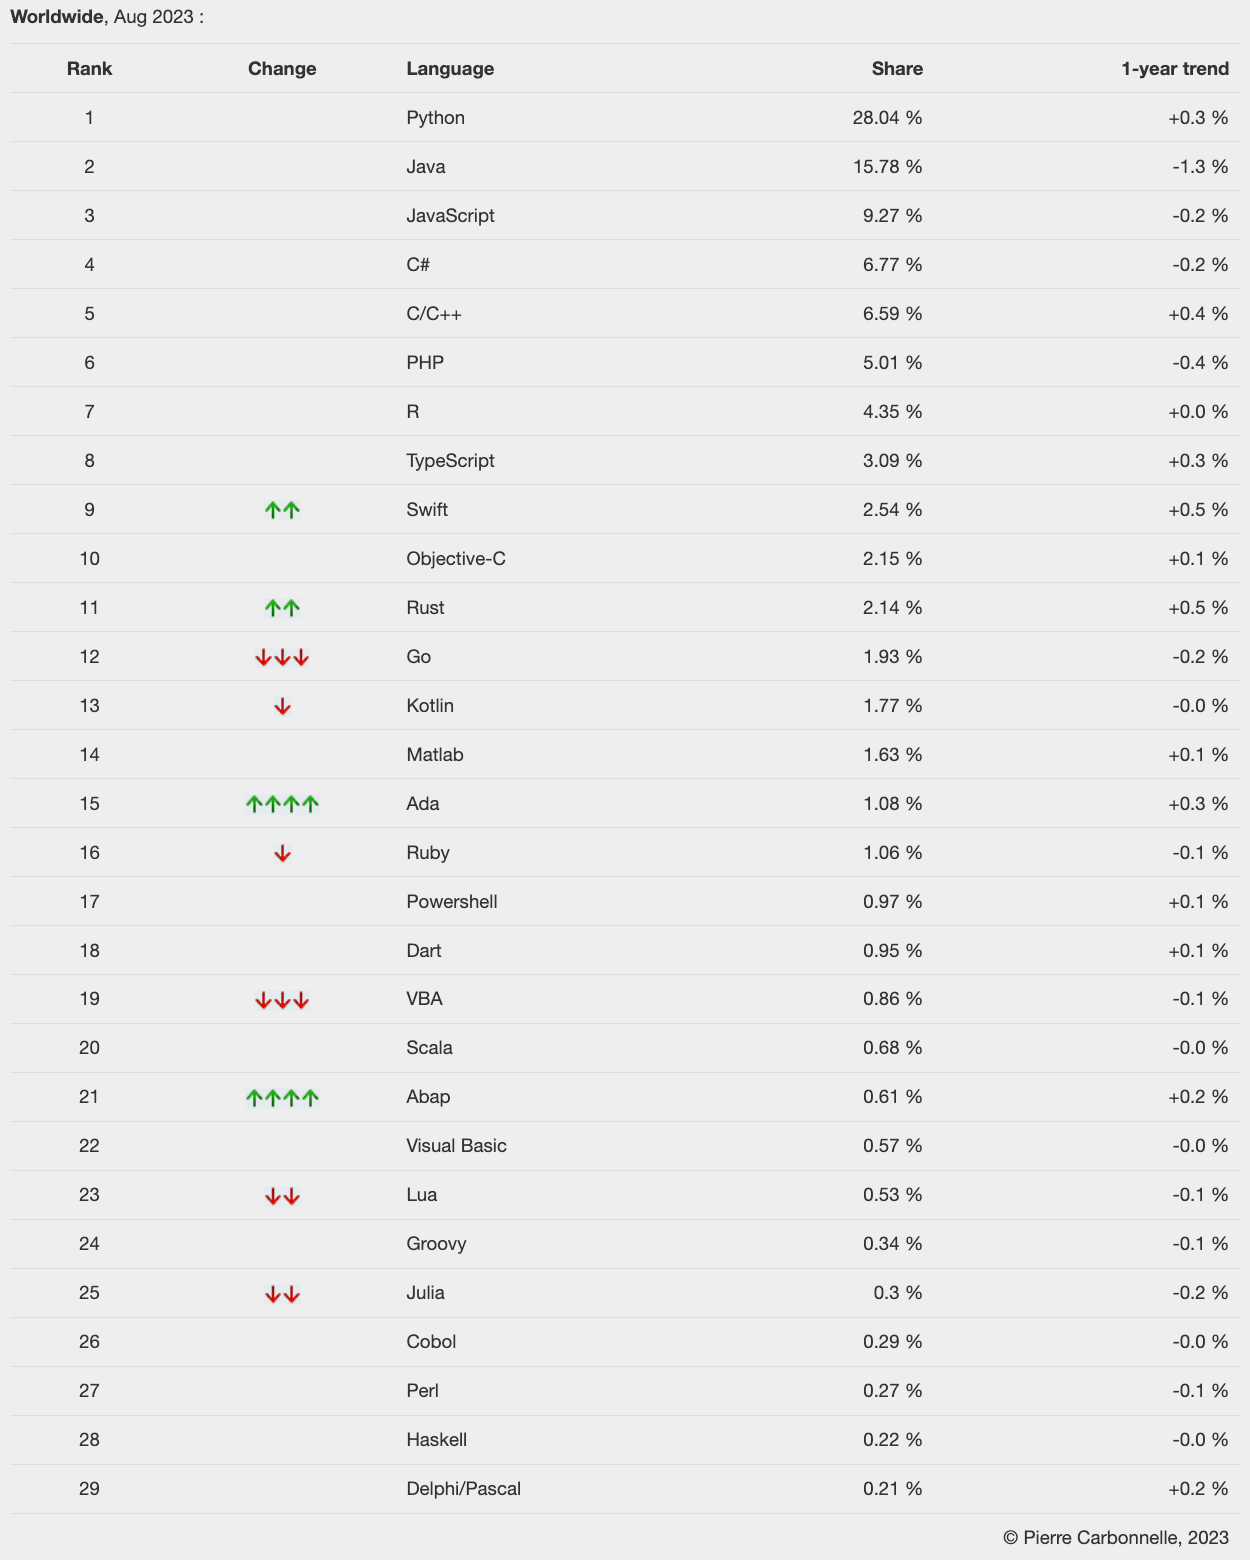
Another popularity index is PYPL Popularity of Programming Language. It searches on the single string, “X tutorial,” making it a leading indicator of what’s likely to be more popular in the future. Since their search string does not focus on data science, the result is for any use. Figure 3c shows the ranking in August 2023. With this approach, Python is still #1, R is #7, MATLAB is #14, and Julia is #25. They update it monthly, so click the link to see their latest.
Software Rating Websites
Compared to the other estimates of software popularity, software rating sites are relatively new. These include:
The reviews at these sites tend to be just a paragraph or two. For a measure of popularity, it’s the number of reviews that are of interest. Volunteers write the reviews, sometimes in response to offers of gift cards. However, the numbers vary widely from site to site. For example, for SPSS, I found 841 reviews (the highest count) on G2, but only 22 on AlternativeTo. But on other software, G2 came out towards the bottom. This high variability makes this data fairly useless for estimating popularity.
IT Research Firms
IT research firms study software products and corporate strategies. For only the dozen or so largest companies, they survey customers regarding their satisfaction with the products and services and provide their analysis in reports that they sell to their clients. However, as the number of tools I cover via job and scholarly use has increased, these reports have become less relevant. So I dropped coverage of them here, but I may include them in future blog posts.
—– Construction Notice 8/1/2023 —–
The sections above are up-to-date; the ones below report data that is several years old. I’ll be updating Surveys of Use next. Some of the other topics, such as numbers of books for each, I may not update.
Surveys of Use
Survey data adds additional information regarding software popularity, but they are commonly done using “snowball sampling,” in which the survey provider tries to widely distribute the link, and then vendors vie to see who can get the most of their users to participate. So long as they all do so with equal effect, the results can be useful. However, the information is often limited because the questions are short and precise (e.g., “tools for data mining” or “program languages for data mining”) and responding requires just a few mouse clicks rather than the commitment required to place a job advertisement or publish a scholarly article, book, or blog post. As a result, it’s not unusual to see market share jump 100% or drop 50% in a single year, which is very unlikely to reflect changes in actual use.
Rexer Analytics conducts a survey of data scientists every other year, asking a wide range of questions regarding data science (previously referred to as data mining by the survey itself.) Figure 4a shows the tools that the 1,220 respondents reported using in 2015.

We see that R has a more than 2-to-1 lead over the next most popular packages, SPSS Statistics and SAS. Microsoft’s Excel Data Mining software is slightly less popular, but note that it is rarely used as the primary tool. Tableau comes next, also rarely used as the primary tool. That’s to be expected as Tableau is principally a visualization tool with minimal capabilities for advanced analytics.
The next batch of software appears at first to be all in the 15% to 20% range, but KNIME and RapidMiner are listed both in their free versions and, much further down, in their commercial versions. These data come from a “check all that apply” type of question, so if we add the two amounts, we may be overcounting. However, the survey also asked, “What one (my emphasis) data mining / analytic software package did you use most frequently in the past year?” Using these data, I combined the free and commercial versions and plotted the top 10 packages again in figure 4b. Since other software combinations are likely, e.g., SAS and Enterprise Miner; SPSS Statistics and SPSS Modeler; etc. I combined a few others as well.

In this view, we see R even more dominant, with a 3-to-1 advantage compared to the software from IBM SPSS and SAS Institute. However, the overall ranking of the top three didn’t change. KNIME, however rises from 9th place to 4th. RapidMiner rises as well, from 10th place to 6th. KNIME has roughly a 2-to-1 lead over RapidMiner, even though these two packages have similar capabilities and both use a workflow user interface. This may be due to RapidMiner’s move to a more commercially oriented licensing approach. For free, you can still get an older version of RapidMiner or a version of the latest release that is quite limited in the types of data files it can read. Even the academic license for RapidMiner is constrained by the fact that the company views “funded activity” (e.g., research done on government grants) the same as commercial work. The KNIME license is much more generous as the company makes its money from add-ons that increase productivity, collaboration, and performance rather than limiting analytic features or access to popular data formats.
The results of a similar poll done by the KDnuggets.com website in May 2015 are shown in Figure 4c. This one shows R in first place, with 46.9% of users reporting having used it for a “real project.” RapidMiner, SQL, and Python follow quite a bit lower, with around 30% of users. Then at around 20% are Excel, KNIME, and HADOOP. It’s interesting to see that these survey results reverse the order in the previous one, showing RapidMiner as being more popular than KNIME. Both are still the top two “point-and-click” type packages generally used by non-programmers.

O’Reilly Media conducts an annual Data Science Salary Survey, which also asks questions about analytics tools. Although the full report of results As their report notes, “O’Reilly content—in books, online, and at conferences—is focused on technology, in particular new technology, so it makes sense that our audience would tend to be early adopters of some of the newer tools.” The results from their “over 600” respondents are shown in figures 6d and 6e.


The O’Reilly results have SQL in first place, with 70% of users reporting it, followed closely by Excel. Python and R follow, seemingly tied for third place with 55%. However, Python also appears in 6th place with its subroutine libraries NumPy, etc., and R’s popular ggplot package appears in 7th place, with around 38% market share. The first commercial package with deep analytic capabilities is SAS, in 23rd place! This emphasizes that the O’Reilly sample is heavily weighted toward their usual open-source audience. Hopefully, in the future, they will advertise the survey to a wide audience and do so as more than just a salary survey. Tool surveys gain additional respondents since they are advertised by advocates of the various tools (vendors, fans, etc.)
Lavastorm, Inc. conducted a survey of analytic communities, including LinkedIn’s Lavastorm Analytics Community Group, Data Science Central, and KDnuggets. The results were published in March 2013, and the bar chart of “self-service analytic tool” usage among their respondents is shown in Figure 6f. Excel comes out as the top tool, with 75.6% of respondents reporting its use.
R comes out as the top advanced analytics tool, with 35.3% of respondents, followed closely by SAS. MS Access’ position in 4th place is a bit of an outlier as no other surveys include it at all. Lavastorm comes out with 3.4%, while other surveys don’t show them at all. That’s hardly a surprise, given that the survey was aimed at Lavastorm’s LinkedIn community group.

Books
The number of books that include a software’s name in its title is particularly useful information since it requires a significant effort to write one, and publishers do their own study of market share before taking the risk of publishing. However, it can be difficult to do searches to find books that use general-purpose languages which also focus only on analytics. Amazon.com offers an advanced search method that works well for all the software except R and the general-purpose languages such as Java, C, and MATLAB. I did not find a way to easily search for books on analytics that used such general-purpose languages, so I’ve excluded them in this section.
The Amazon.com advanced search configuration that I used was (using SAS as an example):
Title: SAS -excerpt -chapter -changes -articles
Subject: Computers & Technology
Condition: New
Format: All formats
Publication Date: After January, 2000
The “title” parameter allowed me to focus the search on books that included the software names in their titles. Other books may use a particular software in their examples, but they’re impossible to search for easily. SAS has many manuals for sale as individual chapters or excerpts. They contain “chapter” or “excerpt” in their title, so I excluded them using the minus sign, e.g., “-excerpt”. SAS also has short “changes and enhancements” booklets that the developers of other packages release only in the form of flyers and/or web pages, so I excluded “changes” as well. Some software listed brief “articles” which I also excluded. I searched on June 1, 2015, and I excluded excerpts, chapters, changes, and articles from all searches.
“R” is a difficult term to search for since it’s used in book titles to indicate a Registered Trademark, as in “SAS(R)”. Therefore I verified all the R books manually.
The results are shown in the table immediately below, where it’s clear that a very small number of analytics software packages dominate the world of book publishing. SAS has a huge lead with 576 titles, followed by SPSS with 339 and R with 240. SAS and SPSS both have many versions of the same book or manual still for sale, so their numbers are both inflated as a result. JMP and Hadoop both had fewer than half of R’s count, and then Minitab and Enterprise Miner had fewer than half again as many. Although I obtained counts on all 27 of the domain-specific (i.e., not general-purpose) analytics software packages or languages shown in Figure 2a, I cut the table off at software that had 8 or fewer books to save space.
Software        Number of Books
SAS                  576
SPSS Statistics      339
R                    240    [Corrected from blog post: 172]
JMP                   97
Hadoop                89
Stata                 62
Minitab               33
Enterprise Miner      32
Table 1. The number of books whose titles contain the name of each software package.
Blogs
On Internet blogs, people write about software that interests them, showing how to solve problems and interpreting events in the field. Blog posts contain a great deal of information about their topic, and although it’s not as time-consuming as a book to write, maintaining a blog certainly requires effort. Therefore, the number of bloggers writing about analytics software has potential as a measure of popularity or market share. Unfortunately, counting the number of relevant blogs is often a difficult task. General-purpose software such as Java, Python, the C language variants, and MATLAB have many more bloggers writing about general programming topics than just analytics. But separating them out isn’t easy. The name of a blog and the title of its latest post may not give you a clue that it routinely includes articles on analytics.
Another problem arises from the fact that what some companies would write up as a newsletter, others would do as a set of blogs, where several people in the company each contribute their own blog. Those individual blogs may also be combined into a single company blog inflating the count further still. Statsoft and Minitab offer examples of this. So what’s really interesting is not company employees who are assigned to write blogs, but rather those written by outside volunteers. In a few lucky cases, lists of such blogs are maintained, usually by blog consolidators, who combine many blogs into a large “metablog.” All I have to do is find such lists and count the blogs. I don’t attempt to extract the few vendor employees that I know are blended into such lists. I only skip those lists that are exclusively employee-based (or very close to it). The results are shown here:
         Number
Software of Blogs Source
R         550     R-Bloggers.com
Python     60     SciPy.org
SAS        40     PROC-X.com, sasCommunity.org Planet
Stata      11     Stata-Bloggers.com
Table 2. Number of blogs devoted to each software package on April 7, 2014,
and the source of the data.
R’s 550 blogs is quite an impressive number. For Python, I could only find that list of 60 that were devoted to the SciPy subroutine library. Some of those are likely to cover topics besides analytics but to determine which never covers the topic would be quite time-consuming. The 40 blogs about SAS is still an impressive figure, given that Stata was the only other company that even garnered a list anywhere. That list is at the vendor itself, StataCorp, but it consists of non-employees except for one.
While searching for lists of blogs on other software, I did find individual blogs that at least occasionally covered a particular topic. However, keeping this list up to date is far too time-consuming, given the relative ease with which other popularity measures are collected.
If you know of other lists of relevant blogs, please let me know, and I’ll add them. If you’re a software vendor employee reading this, and your company does not build a metablog or at least maintain a list of your bloggers, I recommend taking advantage of this important source of free publicity.
Discussion Forum Activity
Another way to measure software popularity is to see how many people are helping one another use each package or language. While such data is readily available, it, too, has its problems. Menu-driven software like SPSS or workflow-driven software such as KNIME are quite easy to use and tend to generate fewer questions. Software controlled by programming requires the memorization of many commands and requires more support. Even within languages, some are harder to use than others, generating more questions (see Why R is Hard to Learn).
Another problem with this type of data is that there are many places to ask questions, and each has its own focus. Some are interested in a classical statistics perspective, while others have a broad view of software as general-purpose programming languages. In recent years, companies have set up support sites within their main corporate web site, further splintering the places you can go to get help. Usage data for such sites are not readily available.
Another problem is that it’s not as easy to use logic to focus on specific types of questions as it was with the data from job advertisements and scholarly articles discussed earlier. It’s also not easy to get the data over time to allow us to study trends. Finally, the things such sites measure include software group members (a.k.a. followers), individual topics (a.k.a. questions or threads), and total comments across all topics (a.k.a. total posts). This makes combining counts across sites problematic.
Two of the biggest sites used to discuss software are LinkedIn and Quora. They both display the number of people who follow each software topic, so combining their figures makes sense. However, since the sites lack any focus on analytics, I have not collected their data on general-purpose languages like Java, MATLAB, Python, or variants of C. The results of data collected on 10/17/2015 are shown here:

We see that R is the dominant software and that moving down through SAS, SPSS, and Stata results in a loss of roughly half the number of people in each step. Lavastorm follows Stata, but I find it odd that there was absolutely zero discussion of Lavastorm on Quora. The last bar that you can even see in this plot is the 62 people who follow Minitab. All the ones below that have tiny audiences of fewer than 10.
Next, let’s examine two sites that focus only on statistical questions: Talk Stats and Cross Validated. They both report the number of questions (a.k.a. threads) for a given piece of software, allowing me to total their counts:

We see that R has a 4-to-1 lead over the next most popular package, SPSS. Stata comes in at 3rd place, followed by SAS. The fact that SAS is in fourth place here may be due to the fact that it is strong in data management and report writing, which are not the types of questions that these two sites focus on. Although MATLAB and Python are general-purpose languages, I include them here because the questions on this site are within the realm of analytics. Note that I collected data on as many packages as were shown in the previous graph, but those not shown have a count of zero. Julia appears to have a count of zero due to the scale of the graph, but it actually had 5 questions on Cross Validated.
Sales & Downloads
Sales figures reported by some commercial vendors include products that have little to do with analysis. Many vendors don’t release sales figures, or they release them in a form that combines many different products, making the examination of a particular product impossible. For open-source software such as R, you could count downloads, but one confused person can download many copies, inflating the total. Conversely, many people can use a single download on a server, deflating it.
Download counts for the R-based Bioconductor project are located here. Similar figures for downloads of Stata add-ons (not Stata itself) are available here. A list of Stata repositories is available here. The many sources of downloads, both in repositories and individuals’ websites makes counting downloads a very difficult task.
Competition Use
Kaggle.com is a website that sponsors data science contests. People post problems there along with the amount of money they are willing to pay the person or team who solves their problem the best. Both money and the competitors’ reputations are on the line, so there’s strong motivation to use the best possible tools. Figure 7 compares the usage of the top two tools chosen by the data scientists working on the problems. From April 2015 through July 2016, we see the usage of both R and Python growing at a similar rate. At the most recent time point, Python has pulled ahead slightly. Much more detail is available here.

Growth in Capability
The capability of analytics software has grown significantly over the years. It would be helpful to be able to plot the growth of each software package’s capabilities, but such data are hard to obtain. John Fox (2016) acquired them for R’s main distribution site http://cran.r-project.org/ for each version of R. To simplify ongoing data collection, I kept only the values for the last version of R released each year (usually in November or December), and collected data through the most recent complete year.
These data are displayed in Figure 8. The right-most point is for version 3.2.3, released on 12/10/2015. The growth curve follows a rapid parabolic arc (quadratic fit with R-squared=.995).

To put this astonishing growth in perspective, let us compare it to the most dominant commercial package, SAS. In version 9.3, SAS contained around 1,200 commands that are roughly equivalent to R functions (procs, functions, etc., in Base, Stat, ETS, HP Forecasting, Graph, IML, Macro, OR, and QC). In 2015, R added 1,357 packages, counting only CRAN, or approximately 27,642 functions. During 2015 alone, R added more functions/procs than SAS Institute has written in its entire history.
Of course, while SAS and R commands solve many of the same problems, they are certainly not perfectly equivalent. Some SAS procedures have many more options to control their output than R functions do, so one SAS procedure may be equivalent to many R functions. On the other hand, R functions can nest inside one another, creating nearly infinite combinations. SAS is now out with version 9.4, and I have not repeated the arduous task of recounting its commands. If SAS Institute would provide the figure, I would include it here. While the comparison is far from perfect, it does provide an interesting perspective on the size and growth rate of R.
As rapid as R’s growth has been, these data represent only the main CRAN repository. R has eight other software repositories, such as Bioconductor, that are not included in Fig. 10. A program run on 4/19/2016 counted 11,531 R packages at all major repositories, 8,239 of which were at CRAN. (I excluded the GitHub repository since it contains duplicates to CRAN that I could not easily remove.) So the growth curve for the software at all repositories would be approximately 40% higher on the y-axis than the one shown in Figure 10.
As with any analysis software, individuals also maintain their own separate collections available on their websites. However, those are not easily counted.
What’s the total number of R functions? The Rdocumentation site shows the latest counts of both packages and functions on CRAN, Bioconductor, and GitHub. They indicate that there is an average of 19.78 functions per package. Given the package count of 11,531, as of 4/19/2016, there were approximately 228,103 total functions in R. In total, R has approximately 190 times as many commands as its main commercial competitor, SAS.
What’s Missing?
I previously included graphs from Google Trends. That site tracks not what’s actually on the Internet via searches but rather the keywords and phrases that people are entering into their Google searches. That ended up being so variable as to be essentially worthless. For an interesting discussion of this topic, see this article by Rick Wicklin.
Website Popularity – in previous editions, I have included measures of this. However, as the corporate landscape has consolidated, we end up comparing huge companies with interests far outside the field of analytics (e.g., IBM) with relatively small focused ones, which no longer makes sense.
Conclusion
Although the ranking of each package varies depending on the criteria used, we can still see major trends. Among the software that tends to be used as a collection of pre-written methods, R, SAS, SPSS, and Stata tend to always be toward the top, with R and SAS occasionally swapping places depending on the criteria used. I don’t include Python in this group as I rarely see someone using it exclusively to call pre-written routines.
Among the software that tends to be used as a language for analytics, C/C#/C++, Java, MATLAB, Python, R, and SAS are always towards the top. I list those in alphabetical order since many of the measures cover not only use for analytics but for other uses as well. Among my colleagues, those who are more towards the computer science side of the data science field tend to prefer Python, while those who are more towards the statistics send tend to prefer R. A language worth mentioning is Julia, whose goal is to have syntax as clean as Pythons while maintaining the top speed reached by the C/C#/C++ group.
A trend that I find very interesting is the rise of software that uses the workflow (or flowchart) style of control. While menu-driven software is easy to learn, it’s not easy to re-use the work. Workflow-driven software is almost as easy — the dialog boxes that control each node are almost identical to menu-driven software — but you also get to save and re-use the work. Software that uses this approach includes Alteryx, KNIME, RapidMiner, SPSS Modeler (the first to popularize this approach), and SAS Enterprise Miner. The wide use of this interface is allowing non-programmers to make use of advanced analytics.
I’m interested in other ways to measure software popularity. If you have any ideas on the subject, please contact me at muenchen.bob@gmail.com.
If you are a SAS or SPSS user interested in learning more about R, you might consider my book, R for SAS and SPSS Users. Stata users might want to consider reading R for Stata Users, which I wrote with Stata guru Joe Hilbe.
Acknowledgments
I am grateful to the following people for their suggestions that improved this article: John Fox (2009) provided the data on R package growth; Marc Schwartz (2009) suggested plotting the amount of activity on e-mail discussion lists; Duncan Murdoch clarified the pitfalls of counting downloads; Martin Weiss pointed out both how to query Statlist for its number of subscribers; Christopher Baum provided information regarding counting Stata downloads; John (Jiangtang) HU suggested I add more detail from the TIOBE index; Andre Wielki suggested the addition of SAS Institute’s support forums; Kjetil Halvorsen provided the location of the expanded list of Internet R discussions; Dario Solari and Joris Meys suggested how to improve Google Insight searches; Keo Ormsby provded useful suggestions regarding Google Scholar; Karl Rexer provided his data mining survey data; Gregory Piatetsky-Shapiro provided his KDnuggets data mining poll; Tal Galili provided advice on blogs and consolidation, as well as Stack Exchange and Stack Overflow; Patrick Burns provided general advice; Nick Cox clarified the role of Stata’s software repositories and of popularity itself; Stas Kolenikov provided the link of known Stata repositories; Rick Wicklin convinced me to stop trying to get anything useful out of Google Insights; Drew Schmidt automated some of the data collection; Peter Hedström greatly improved my search string for Stata; Rudy Richardson pointed out that GraphPad Prism is widely used for statistical analysis; Josh Price and Janet Miles provided expert editorial advice.
Bibliography
J. Fox. Aspects of the Social Organization and Trajectory of the R Project. R Journal, http://journal.r-project.org/archive/2009-2/RJournal_2009-2_Fox.pdf
R. Ihaka and R. Gentleman. R: A language for data analysis and graphics. Journal of Computational and Graphical Statistics, 5:299–314, 1996.
R. Muenchen, R for SAS and SPSS Users, Springer, 2009
R. Muenchen, J. Hilbe, R for Stata Users, Springer, 2010
M. Schwartz, 1/7/2009, http://tolstoy.newcastle.edu.au/R/e6/help/09/01/0517.html
Trademarks
Alpine, Alteryx, Angoss, Microsoft C#, BMDP, IBM SPSS Statistics, IBM SPSS Modeler, InfoCentricity Xeno, Oracle’s Java, SAS Institute’s JMP, KNIME, Lavastorm, Mathworks’ MATLAB, Megaputer’s PolyAnalyst, Minitab, NCSS, Python, R, RapidMiner, SAS, SAS Enterprise Miner, Salford Predictive Modeler (SPM) etc., SAP’S KXEN, Stata, Statistica, Systat, WEKA / Pentaho have registered trademarks of their respective companies.
Copyright 2010-2022 Robert A. Muenchen, all rights reserved.
i’m not surprised that R, in particular, has done spectacularly well with respect to analytic use – it has, as best i can tell, virtually all the analytic tools one might need. I’ve been worried for decades now about the ever increasing use of excel for both data mgt and analysis. So many projects/”data sets”/ analyses have come our way in excel spreadsheets only for major problems in data integrity, tracing flow of data changes that led to errors, even analyses that were later found to be completely hosed because a user had done something as simple, and as deadly, as sorting a column instead of the records/rows.
What SAS has and,really should concentrate on, is its data handling, manipulation, organization, data validation features..that are all built into Base SAS. I have, and appreciate, your R for SAS/SpSS Users – and i can’t help but think that organizations that rely on both “data integrity” which, really, is SAS’ great strength and analysis could profitably use SAS for complex data manipulations and then write out files in one of the many formats R takes, do the analytics in R and pull the results back into Base SAS. A few months ago i helped out a friend who was analyzing generational data drawn from 80 + yrs from the complete medical birth registry of Norway. SPSS is the data manipulation software they use..and the task of linking families, sibs, half sibs with flags/subsets for individuals/families that had various birth defects over multiple generations was seemingly intractable in SPSS, whereas while it was a non-trivial exercise in SAS, it was certainly conceptually straight forward. And the resulting files could be analyzed in either R or SPSS, of course.(or SAS – which isn’t a package that they licence because of its increasingly pricey )
I’ve done quite a lot of complex data management in SAS, SPSS and R. To me they seem quite similar in capability except that R must fit the data into the computer’s main memory (unless you’re using Revolution Analytic’s version). Where SAS may have the edge is reading unusual files where you have to read some data and, based upon that data, decide what other data to continue reading. I see that type of data rarely and I’ve only read it in SAS. The others may be able to do it but I haven’t taken the time to see if they can or not.
“To me they seem quite similar in capability except that R must fit the data into the computer’s main memory”
I’ve been thinking about this lately, and I wonder if this might be a blessing in disguise? Every time our group hits memory constraints, we buy more RAM. It’s cheap, and it grows exponentially cheaper/larger over time. Of course, that doesn’t work for “very large problems”. But, on the other hand, there’s the MapReduce paradigm of divide-and-conquer. I don’t often encounter datasets that I can’t subdivide and process in chunks. Working with on-disc data is orders of magnitude slower (though SSD seems to help quite a bit), and so the dataset-in-RAM paradigm strikes me, after some thought, as a “good idea in disguise”.
See the bigmemory package for R:
http://cran.r-project.org/web/packages/bigmemory/index.html
Excellent summary, thank you very much. The exponential growth of R packages is impressive.
I am trying to catch how you measured the statistical softwares on the job market.
Indeed a research with just “R” leads of course to nothing meaningful. I would search for expressions like theses :
“STATA (statistic OR statistical)” = 627
“MINITAB (statistic OR statistical)” =1277
“SPSS (statistic OR statistical)” = 2488
“R (statistic OR statistical)” = 2957
“SAS (statistic OR statistical)” = 7053
which shows the prevalence of SAS, but to a less degree.
Many of the strings are easy:
JMP, BDMP Minitab, SPSS, Stata, Statistica, Systat
And SAS isn’t too bad but but you have to exclude any hard drive interface references for which SAS has another meaning:
SAS (excluding SATA, storage, firmware)
R is devilishly difficult to get. Since you found more jobs for R than for SPSS I’m pretty sure you’re getting mostly bad hits. You have to study a lot of the job descriptions to see what’s actually being found. Plain old “R” is found in many irrelevant situations. I use a Linux shell script that searches for:
(“SAS or R” or “R or SAS”) and it repeats that pattern for the above packages and MATLAB, SQL, Java, Python, Perl
After much study that is the only way I have found to locate “R” that is relevant. If you find another way, I’d love to hear it!
The whole thing is a Linux shell script written by a former research assistant. A variation of it which I used for figures 7a and 7b is described in detail at:
http://librestats.com/2012/04/12/statistical-software-popularity-on-google-scholar/
Another option to exclude lists is to manually inspect N samples of each query and estimate the chance of a query to be relevant. For example, you may get 5000 hits on an R query and estimate 1/20 to be referring to the statistical software -> approx 250 hits.
Hi Jakob,
I ended up doing something similar as described in How to Search for Analytics Jobs. I’ll update the post to reflect this new perspective 2/25/14.
Cheers,
Bob
thank you for this stats article just what i needed
It would be interesting to include popular scientific plotting and statistics packages such as Origin Pro, SigmaPlot, and GraphPad Prism.
Nice idea! However, I keep pretty busy collecting the current data.
Where you say, “No other data analysis languages covered by this article even make their top 100.”, is not true. If you look at the portion that says the next 50, covering 51-100 you will see S, S-PLUS, and SPSS which are all data analysis languages. It is also debatable that MATLAB, PL/SQL and Transact-SQL could be considered data analysis languages.
Ken, thanks very much for pointing that out. One of the hardest things about tracking so many sources of information is noticing all the changes that are relevant! I’ll deleted that sentence.
This is a very good article. I especially admire the way you have tried to quantify various measures. It’s worth reading just to learn that you can use “not” operators on google and amazon. Most illustrative of trends in stats packages and languages. Thank you!
Thankfulness to my father who shared with me regarding this website,
this webpage is genuinely remarkable.
One interesting thing to look at could be comparing trends from the kdnuggets polls. You have the current year but there is also links to some of the prior years. For instance the following show two very different perspectives from two different points in time.
http://www.kdnuggets.com/polls/2011/tools-analytics-data-mining.html
http://www.kdnuggets.com/polls/2008/data-mining-software-tools-used.htm
I am not sure what all could be done with this but it would be interesting.
That’s good idea. I’ll do it if I can find the time!
I’m curious about a review of tools used by non-statisticians for analysis in business. Do you know what products that help smooth some of most basic data related tasks that the masses are currently doing in Excel — such as pivot tables, commenting and collaboration? I’ve been building one to try to answer this, and am curious about others!
Thanks for all of the details on tool functionalities and preferences for true big data analysts!
Fantastic! Is this published somewhere peer-reviewed that I can cite? I’m working on a journal article (which strongly discourages citing webpages) and would love to cite this as a source.
Sorry, it’s only available on this web site. I’ve had editors ask me to submit it, but I prefer to keep it as a living document that changes with the data.
Hello! Do you use Twitter? I’d like to follow you if that would be okay. I’m absolutely enjoying
your blog and look forward to new posts.
I’m @BobMuenchen on Twitter and I do tweet when each new post or article is finished. It’s certainly OK to follow me. I don’t tweet a lot, so you won’t be bombarded with crazy messages about where I’m eating lunch!
SAS just doesn’t seem affordable except for corporations. Do they even have a single user academic perpetual license?
SAS Institute never does perpetual licenses. A single user academic license is very expensive but they do make it very cheap per copy when you get an unlimited-copies license.
I have quite a wonderful “ANCIENT” book that has a comparison of Stats/database packages circa 1980 back in my office. I DO remember that back in the day….the yearly license for the “Statistical Analysis Software” package was $1000.00 for a university. If I could attach a pdf I actually scanned the chapter on “General Statistical Packages.” The book was basically the result of a survey of users…My favorite line: “More importantly, SAS’s users think almost as highly of this program as its developer does”
I use SAS & SPSS frequently for clients and like them both. But when I get to choose, I usually use R.
lovely post.
one tiny error– there are two captions titled the same serial “7a”.
maybe you mean 7b in the latter one.
That’s fixed now. Thanks very much for reporting it!
“quiet” under Fig. 1d should be “quite”
It’s fixed. Thanks!
Hello! I know this is kinda off topic however I’d figured I’d ask.
Would you be interested in exchanging links or maybe guest writing a
blog post or vice-versa? My blog covers a lot of the same topics as yours and I believe
we could greatly benefit from each other.
If you might be interested feel free to shoot me an e-mail.
I look forward to hearing from you! Superb blog by the way!
I’d love to see how Julia (julialang.org) fairs over the coming years 🙂
Do you think you can include more of KNIME in some of your graphs? I am curious to see how it compares. I use KNIME and I have seen it cited only in figure 3 and figure 4.
Hi Rosaria,
I started out studying just classic statistics packages while the data mining software came from data collected by others. However I do hope to expand the graphs next year to include them. There’s little real difference between the two types of software other than the user interface, which is better on most data mining packages.
Cheers,
Bob
This is absolutely amazing. Given the passion that most scientists have towards their software packages and that you are a self-proclaimed Stata user, I’m amazed that you can have such an unbiased and rational approach to answering this question.
1) There seem to be way too many stats packages.
2) I was happy to see Number Cruncher Statistical Analysis in there. The copy I have is 10 years old, but I still use it for 3d graphing capabilities.
3) I conducted a web search of “SAS vs Stata” because a coworker uses Stata and won’t shut up about it. I use SAS/Excel…and won’t shut up about it. My hypothesis was that my coworker is using an outdated stats package and he is stubbornly set in his outdated ways. This article mostly disproves that hypothesis, but does give me some ammo on the comparison. Thanks!
Hi Fred,
I actually use Stata only occasionally, and then usually just to study how it does a particular thing. My co-author Joe Hilbe is the Stata guru. It is a beautiful system though. You can tell that a tiny number of people cared about making its structure consistent. SAS, SPSS and especially R were at the mercy of too many developers so their syntax is less consistent. All four are wonderful packages though, and each has an audience that thinks it’s the best by far. I like ’em all!
Cheers,
Bob
Bob,
I’ve used R for years, and just bought Stata/IC 13 yesterday for several reasons. First, the company has a great attitude/culture and it’s always good to deal with a company where you like the people. Second, it seems to me to be the best option among SAS, SPSS, Minitab, et al, and it’s also a better deal for an individual purchaser. Third, it implements some algorithms that are more advanced than the R equivalents. And fourth, Stata 13 was just released and has a lot of nice new features.
My first thought is that it reminds me a lot of Igor Pro, by Wavemetrics, which I used to use. They both have a great bunch of people (developers and users), a great culture, an interface that you can drive via commands or a GUI (though the GUI generates the command line equivalents so you can learn it or reuse it), and a consistent flavor. The difference being that Stata is statistics-oriented, while Igor Pro is scientific/experimental-oriented.
I like Stata a lot, but it won’t replace R. I’d say that it’s much more elegant than SAS, et al. (SAS was developed for punched cards and influenced by IBM’s punched-card JCL, and has all kinds of obvious seams between its various parts. It’s definitely a Frankenstein.) I’d disagree with you that Stata’ syntax is more consistent than R’s though. I believe you’re talking about how functions in R have been written by various people, so the function calls may have some inconsistent argument names or perhaps result formats. On the other hand, Stata suffers from the data (essentially a spreadsheet) versus free-form variable (r(), e(), _b, _se, etc) distinction, which itself sets up various inconsistencies and makes me feel claustrophobic.
So I still think that R’s the best option, but have definitely added Stata to my toolbox and it will be there long-term. I’d definitely recommend it to others.
To some degree, I think it makes a difference what direction you come to statistics from. If you’re used to programming and like having the full machinery and flexibility of a programming language, R makes a lot of sense. If you don’t really program — you just want to give commands and get results — though you want the option of automating some things or using programs that others have written, Stata makes a lot of sense.
Hi Wayne,
Thanks for your interesting comments. I’ve talked to a couple of other people recently make the point that R is better as a programming language, while Stata is easier to use as a way to control pre-written procedures. SAS certainly has some odd inconsistencies, but I’ve used it for so many years that they seem second nature to me.
Cheers,
Bob
Hi Bob,
As I mentioned before, my coworker uses Stata and I use SAS/Excel. Unfortunately, my coworker has retired and I have no way to validate my SAS/Excel code with her Stata output. If I were to provide the code that my coworker used, datasets, and any other information required, could you reference somebody to me who can run a Stata program? I can’t seem to find anybody who runs Stata!
Any information is helpful.
Thanks!
“Fred”
Great analysis, as always. This is a great resource for the entire analytics community. Thanks!
Hi Karl,
Thanks very much! I really look forward to seeing your survey results each time. Keep that data coming!
Cheers,
Bob
Hi Bob,
Thanks for providing an overall big picture of statistical packages. I am using SAS from past couple of years and is preparing for its certification too. As a beginner I always used to wonder about the differences among different statistical packages but your article has answered a lot of my questions.
Thanks.
Hi Kamal,
I’m glad you found it useful.
Cheers,
Bob
so why does SAS Institute still make 2.5 $ billion every year. Your data is overwhelmingly conclusive- but the SAS revenue is what makes me a hold out believer
Hi Ajay,
As far as I know, SAS Institute is still the largest privately held software company in the world and I don’t see that changing anytime soon. They continue to innovate, especially by offering complete solutions to problems rather than just offering tools that let you come up with your own solutions. I think the whole analytics pie is getting much larger. While SAS gets a smaller slice of this pie each year, it still adds up to more revenue.
Cheers,
Bob
Nice data on use of different packages. A couple of comments. It would be interesting to know who is using what software and for what purposes. As an experimental psychologist, for example, I very much like SPSS for its handling of analysis of variance (both GLM and the older Manova). When I was generating course evaluations on my campus for a number of years, I liked to use SAS because of its powerful relational database functions (SQL). The same things could be done in SPSS but not nearly as “elegantly.” Is it perhaps the case that different classes of users are finding the features they need in particularly packages? Finally, we might like to believe that the “best” product wins out, but that is not always the case with respect to software (e.g., Word vs Wordperfect?) and should perhaps warrant some caution with respect to usage statistics. Nice job!
Hi Jim,
You make some good points. Different packages definitely dominate in different market segments. Our campus (University of Tennessee) has a large social science presence and SPSS dominates by far overall. However, among economists Stata is dominant, the agriculturalists and business analytics folks use SAS, and while R use is in the minority, it seems like every department has someone on the cutting edge of their field using R.
I like all these packages for their various strengths and agree that it makes little sense to say which is “best” for everyone.
Cheers,
Bob
Extremely engaging. Although Sage is much more than a statistical package, it encompasses statistics, and it would be interesting to include it in the mix.
Should the caption for figure 1a say, “MORE popular”? The caption appears same as the one for Figure 1b
“Figure 1a. The number of analytics jobs for the less popular software”
“Figure 1b. The number of analytics jobs for the less popular software”
Your descriptions of the challenges faced when compiling data from readily available but harder to interpret data shows how much work you have put into this site. Thanks!
Hi John,
Thanks for catching that! It’s fixed. Regarding the amount of work, I wish I had tracked it. I do know that the job search section alone took over 100 hours. Now that I understand the problem better, I can update the figures in about an hour, but determining the optimal searches was really difficult.
Cheers,
Bob
The primary reason I show either both Stata and R code or just R code for the examples in my books now is due to the fact that the far majority of statistics journal manuscripts that I referee or edit use R for examples. SAS and Stata seem to come in as the second most used stat packages. However, I realize that this may in part be due to the type of manuscripts I referee. I’m on the editorial board of six journals, and am asked to referee by a number of others. But these are generally related to biostatistics, econometrics, ecology, and recently astrostatistics (where Python and R are most common). It also seemed to me that most of the books I read or referenced when researching for my books also used R for examples, followed by Stata and SAS.
The second reason is due to the students I teach with Statistics.com. I teach 5 courses (9 classes a year) with the company. These are month long courses over the web with discussion pages which I use to interact with those enrolled in the courses. A good 95% (seriously) of enrollees are active researchers working in government, research institutions, hospitals, large corporations, and so forth, as well as university professors wanting to update their knowledge of the area, or learn about it if they knew little before. Students come from literally everywhere — the US, UK, Italy, Australia/NZ, Brazil, China, Japan, South Africa, Near Eastern nations, Nigeria, and even Mongolia. I always ask for their software preference, and have on average 15-30 students. Logistic Regression is the most popular course followed by Modeling Count Data. R is by far the most used software package. I started teaching with Statistics.com their first year (2003) , using Stata. I would accept submissions using SAS and SPSS, but the course text and handouts I used were in Stata. It is a very easy package to learn and it has a very large range of statistical capabilities. But I increasingly had more and more students wanting to use R. So I started to become more proficient, co-authored R for Stata Users with Bob Muenchen, (2010) which really spiked my knowledge of the software and now used the two package equally. My “Methods of Statistical Model Estimation” book with Andrew Robinson (2013) is a book for R programmers, and “A Beginners Guide to GLM and GLMM using R” (2013) with Alain Zuur and Elena Ieno uses only R and JAGS – I am ever more becoming a Bayesian as well. Other book, like my “Modeling Count Data” (Cambridge Univ Press) which comes out in May uses both R and Stata in the text, with SAS code for the examples in the Appendix. R, JAGS, and SAS is used for the Bayesian chapter.
Look through the new books that are being authored and the journal articles being published by the major statistics journals. Its mostly R, Stata, and SAS, with SPSS also used in books/journal articles specifically devoted to the social sciences. Minitab occasionally as well. Python and R almost exclusively for the physical sciences. For the many new books on Bayesian modeling, most use WinBUGS/OpenBUGS and R (and R with JAGS), and some SAS. I see Python becoming more popular though.
For what its worth, I’ve seen a lot of software over the years, From 1997 to 2009 I was Software Reviews Editor for The American Statistician, and received free stat software to review and use for 12 years and pretty much still ongoing. I turn 70 this year, so have watched the development of statistics and statistical software for quite awhile. I would not purchase stock in SPSS, nor in SAS for that matter. SAS is ingrained in the pharmaceutical and healthcare industry, and in much of “big” business, folks have jobs as SAS programmers, or SAS analysts. Too much is invested by business to simply drop it. But that’s not the case as much with SPSS. With more Revolution-like businesses developing in the next decade, I believe R will predominate as the Franca Lingua statistical software. Stata will become ever more popular, but needs to develop a strong Bayesian component. Its not difficult to do given Stata’s excellent programming and matrix languages. Python, OpenBUGS (WinBUGS is not being developed any more), JAGSs and perhaps some other Bayesian software will grow fast in use as well. The Predictive Analytics movement is having an influence as well, and together with academia is focused on employing more Bayesian, basic sampling, and enlightened machine learning into the analysis community.
Hi Joe,
It’s good to hear from you! I, too, have noticed the rapid growth of R used as code examples in journals and books. I only measure books that use the software name in their titles since they’re easy to find. However, I do think it would be much more indicative of R’s dominance to somehow count the books that used R in examples. I see some that use R and Stata, or R and SAS, etc. so R may already be the dominant software used across all stat books.
Cheers,
Bob
Dear Sir,
The page linked below describes the capabilities of four different statistical software, and was intrigued to see a rather different take on capabilities of Stata. I love Stata, and it is a great tool to do routine in-built type analysis, but may its programming abilities are not that great?
http://stanfordphd.com/Statistical_Software.html
Completely agree with your comment on Stata and pleased to see Stata now officially incorporate Bayesian/MCMC modelling starting from Stata 14.
R often boasts about its number of libraries available, but curiously there seems lack of R package for Bayesian. There is MCMCpack but it is very basic. R users as you said typically depend on other softwares such as OpenBUGS, JAGS, Stan for fitting Bayesian models. This means yet another software to install and another language to learn (some such as BUGS is similar to R but some may not).
I have not got a copy of Stata 14 yet but I found the PROC MCMC in SAS is very good and is my choice for Bayesian modelling at the moment.
There’s rstan and rstanarm. Also, runjags has a function that outputs a model for you. Hopefully in the near future going Bayesian will be a little more straight-forward.
I am getting addicted by your writings. I am a student of statistics and want to learn as much as possible from your writings.
Hi Partha,
I’m glad you’re enjoying them. It motivates me to keep working!
Cheers,
Bob
Excellent article, very detailed presentation of data. Good to follow the analytics trend. Thank you for this article.
Nice article, and impressive thinking too!
Just one query: In fig. 1a (2/2014), don’t you mean over 250 jobs, not under?
Hi Simon,
Thanks for catching that typo! It’s fixed.
Cheers,
Bob
hello all,
I am a graduate of statistics. i want to focus my career in customer insight analysis, building predictive models. i have. learnt sql and SAS programming for data extraction and manipulation. I am confused on which stat package to really learn for data mining. I know SAS EM but feel coys wont employ based on point and click. What about SPSS? I would love to learn SAS programming for data minin on BASE SAS. Pls any recommendations as well as. books to read? thanks a lot.
This is great, but you’re missing out on a lot by only looking at tools that are 10+ years old. There is a lot of innovation in the industry right now with new players like Tableau and Looker in the mix.
Hi Jonathan,
Tableau is shown in figures 2a, 6b, 6d and 6e. However, most of those are from people who collected their own data. I’m focusing on advanced analytics or predictive analytics. Tableau is more of a visualization package. It does a nice job with a small number of variables but you can only see perhaps 8 at a time on a graph (x, y, z, color, size, shape, small multiples, time in animation). Even with that many it’s hard to absorb. The other software can find patterns in hundreds or even thousands of variables. I just edited the paper to make the focus more clear.
Cheers,
Bob
I have found another rather popular data-analysis software called SCaVis (http://jwork.org/scavis/). It looks like it has about 150 weekly dowloads since 2005. Doyou have any opinion about it?
Hi REmi,
No, I haven’t tried that one.
Cheers,
Bob
That was fascinating. Thanks for all of the effort.
I’m curious about the enormous decline in Fig 2b in scholarly articles citing SAS and SPSS, from a peak ca. 2007. Fig 5A also shows a dramatic reduction in references to SAS at around the same time. At one point in the article you mention competition from R, suggesting that free software edged out pricey packages. But this hypothesis isn’t really borne out by Fig 2b. The numbers for R are so much smaller that they don’t make up the loss– instead, the total number of google scholar hits citing analytics packages decreases dramatically. It appears to suggest a net loss of productivity. What is going on? I was thinking it might be a major drop in biomedical research funding from NIH, but that happened ca. 2000 which seems too early. When the grant money dries up, the license won’t get renewed. The lag time for that effect to show up in publications might be several years.
Hi Arlin,
Good point. I’ve been asked this so many times that I should have modified the text by now. Here’s what I’ve added: “Note that the decline in the number of SPSS and SAS articles is not balanced by the increase in the other software shown. This is likely due to the fact that those two leaders faced increasing competition from many more software packages than I have time to track.”
Cheers,
Bob
It could be argued that programs such as JMP emphasize data visualization or visual data exploration, but it is not excluded from the comparisons. With this in mind I would urge inclusion of GraphPad Prism and OriginPro — these programs certainly have excellent visualization and graphing capabilities, but they also offer considerable strength in data analysis and statistics. In any event, thank you for a most interesting and thorough comparison of other data analysis and statistics software.
Hi Hypersphere,
That’s a good point. Just as the classic stats packages have added much better visualization, the viz packages have added statistics blurring the difference. However, I’m barely keeping this document up to date as it is. It’s a lot of work!
Cheers,
Bob
Hi Bob,
Thanks for taking the time to reply. If you should decide to add a software package or two to your list, please keep Origin Pro and GraphPad Prism in mind. These packages are used by quite a few scientists and engineers.
Best wishes,
Hypersphere
Thank you for the useful, empirically backed findings, and the practical R search query.
Hi Dragosh,
I’m glad you found it useful.
Cheers,
Bob
Dear Bob,
thank you for this informative article! I referenced it in my own blog (in german), also showing your figure 1a (with appropriate credits). Hope that’s ok. http://www.4falter.at/sk/2015/06/5-gruende-fuer-biologinnen-und-biologen-r-zu-lernen-und-5-gruende-es-nicht-zu-tun/
Thanks!
Cheers,
Stefan
Hi Stefan,
Yes, that’s fine. I used to be fairly fluent in German, but that was 35 years ago.
Cheers,
Bob
Awesome review, thank you!
Hi Adam,
I’m glad you liked it!
Cheers,
Bob
Dear Bob,
I really appreciate your scholarly approach to this question.
I have just started introducing R to spanish speakers in Ecuador, many of whom regard it with great suspicion and resent it doubly for being code-based and in english. I am looking for an analysis of the popularity of R amongst its peer programs, considering users with first-languages, or work contexts other than english.
My question is, are you aware of an analysis of this type that adjusts for the language “problem”?
regards,
David
Hi David,
I’ve thought quite a bit about the “language problem” and I think it helps explain the dominance of SPSS. While its language is only usable in English, SPSS uses a graphical user interface that is available in many different languages. So it has the advantage of being easy to use in any popular language. All the programming-based packages like R, SAS & Stata face the same language barrier.
Unfortunately, I’m unaware of any analysis that attempts to quantify this effect, so it’s all just guesswork on my part.
Cheers,
Bob
Earlier in August I remember seeing that Ajay Ohri posted some introductions to R, Python and SAS — these were in Spanish. In case they are helpful for you, here is the link: http://decisionstats.com/2015/08/21/more-hispanic-data-scientists-please/
Bob, awesome article. Thank you so much for the time/effort it took to produce such an in-depth study.
I came across this article as I’ve slowly slipped into a mild depression (kidding. . . kind of) after I recently graduated with a Masters in Statistics and found that virtually no job advertisement requires STATA, my statistical package of choice. There is some hope, however, as it looks like SAS may be on the decline relative to STATA. *fingers crossed*
Hi Jake,
Stata is really interesting. The first chapter in my book, “R for Stata Users” talks about all of the similarities between R and Stata. If you’ve been programming in Stata – rather than pointing & clicking on the menus – you should be able to transition to R more easily than a SAS programmer would. As you can see, the use of Stata in scholarly work is growing as rapidly as R, but you’re right, in the corporate world, it’s rare to find a job looking for it. One of the attributes it shares with R is having to store its data in the computer’s main memory. There are a few ways to break that limit in R, but I don’t know offhand if there are similar ways to do that in Stata.
Cheers,
Bob
I really like Stata. It “feels” similar to R via R-Studio and offers a bit of hand-holding by providing some menus. Although Stata’s coverage of statistical procedures is superb, I think if they were to be more forward-looking by serving as an interface to R, then they would garner many more users. Unfortunately, thus far Stata has not embraced this concept.
This is great, as a librarian, I’m trying to figure out which software packages our University should be investing in for our computer labs. I’m going to use this as reasoning for our choices. If you know of anyone doing similar things with qualitative data software, let me know! (nvivo etc)
Hi Jazz,
As a matter of fact, I’ve done a bit of the same thing for qualitative tools. The quickest way to do this is to use http://www.google.com/trends. Click this link to see how very dominant NVivo is compared to the rest:
https://www.google.com/trends/explore#q=nvivo%2C%20atlas.ti%2C%20Maxqda%2C%20%22QDA%20Miner%22&cmpt=q&tz=Etc%2FGMT%2B4
Note that QDA Miner Lite is free and quite good.
Cheers,
Bob
Extremely informative. Thanks! Professor David Rice
Hi David,
I’m glad you enjoyed it!
Cheers,
BOb
Thank you so much for this article! I’m a disgruntled SAS user/teacher and a grouchy SPSS user/teacher. I’m an R promoter, so these statistics are helpful for me to communicate to my students the cost/benefit of spending their precious time learning SAS vs. SPSS vs. R.
Gorgeous data visualizations as well! Thanks again for this very extensive and neatly-presented analysis.
Hi Monika,
I’m glad you found it useful. It’s really hard to get the SPSS point-and-click crowd to get excited about R. I hope someone does a really open source good front end to R to help non-programmers. Several are working on it but all seem to have a long way to go.
Cheers,
Bob
Hi Bob, do you have any official publications for these data? It looks like you occasionally update them so I’m wondering if I was to cite this how things might change in time. Many thanks for putting this together.
Hi Mcarson,
I’ve kept the name the same even though “data analysis” is now referred to more accurately as “data science.” So you can find it in the long run at http://r4stats.com/articles/popularity. Unfortunately, I update it every year, so what might have been “Figure 2b” a couple of years ago is likely a different graph today! I’ve never tried it, but I’m told this site https://archive.org/web/ offers snapshots of history, so you might be able to find old versions there. If you try that, please let me know how well it works!
Cheers,
Bob
P.S. stay tuned for a major update this week!
I really like Stata, but I fear that its reluctance to interface with R could work against its continued acceptance. The same could be said of Matlab. To their credit, there are several programs that include interfaces to R — these include JMP Pro, Origin Pro, and Statistica. Not surprisingly, JMP Pro also has an interface to SAS. Origin Pro seems the most forward-thinking, with interfaces to C, Mathematica, Matlab, and R. Moreover, OriginLab has informed me that they are committed to developing the R console in Origin Pro into a more full-fledged GUI for R — this would be useful for enlarging the scope of statistical procedures available from Origin Pro and enhancing the interactive editing of plots in R.
What about XLSTAT?
Hi SPQR,
I don’t cover packages that only work in combination with other spreadsheets, databases, etc. If you’d like to start tracking those, I’d be happy to put a pointer toward your blog!
Cheers,
Bob
Hi Bob,
Why not covering these packages?
You listed the different factors you used to exclude or include softwares without explaining the reasons.
Thanks for your answers.
Not sure what does “Java” mean in there charts. Java is the language. Talking about Java, I think DMelt from http://jwork.org/dmelt/ should be on top of this list. It is a way more comprehensive than some of the listened packages.
Hi Jhepwork,
The general purpose languages in this data are a bit confusing. To clarify, I’m not interested in Java for any use, only for data science. So I use the search string listed below. I document all the search strings here: http://r4stats.com/articles/how-to-search-for-data-science-articles/. The best Google Scholar search string I could develop for datamelt is:
“datamelt” -“datamelt index”
There’s something called a “datamelt index” that has nothing to do with the Datamelt software, and that minus sign gets rid of that. There are only 11 scholarly articles found for all years with that search, so I won’t start tracking it until its usage increases. It looks pretty cool though!
I strongly recommend dropping the second name of “Dmelt”. Google Scholar finds 214 articles on that, and most have nothing to do with the Datamelt software. Datamelt is a nice descriptive name and one that’s easy to search on. It’s fine for people to refer to something by an abbreviated name when speaking, but you don’t want people citing it by anything but its proper name if you want to be able to accurately track its use. Thanks for bringing Datamelt to my attention, and please write me when its annual use puts it into 100+ articles per year.
Cheers,
Bob
My current Java data science search:
java -author:java -weka -“Practical Machine Learning”
-indonesia (“statistical analysis” OR “t test” OR
“regression analysis” OR “quantitative analysis” OR
“data analytics” OR “machine learning” OR
“artificial intelligence” OR “analysis of variance” OR
“anova” OR “chi square” OR “data mining”)
Hi Bob,
Very nice article and I loved the facts & figures. I own a book you authored “R for SAS & SPSS Users” this book helped me immensely on a project where I was translating SAS to R and implementing the R code on Hadoop via RHADOOP. Thanks for your great service!!!
Hi R. Kahn,
I’m glad you found this info useful. It’s a lot to maintain!
Cheers,
Bob
This blog awesome and i learn a lot about programming from here.The best thing about this blog is that you doing from beginning to experts level.
As a popularity metric maybe you could use the number of MOOCs (massive open online courses)? But you would have to correct for the number of students registered or certificates awarded. I am not sure how open the data is. Just an idea, probably already suggested. Thank you for your hard work!
Hi Luna,
That idea has been in my queue for a couple of years now, but I haven’t gotten around to tackling it. As you point out, it’s a messy one! Some sites, like DataCamp, have lots of great classes on R and Python, but little else. Companies like SAS and IBM/SPSS offer training, but I doubt they’d give out their attendance figure. MOOCs have a lot of people sign up, but far fewer complete the classes. I’d love to find a simple solution to this, even if it’s not a perfect one (all the other measures have their limitations).
Cheers,
Bob
I’ve tried to do an update to to your R versus python plot for Kaggle by looking at the new scripts facility there. R and python are looking much like parity. https://www.kaggle.com/mlearn/d/kaggle/meta-kaggle/python-vs-r-as-seen-in-kaggle-scripts/notebook
Hi mlearn,
Very nice work! I’ll update my blog to reflect this & do a ping-back to your post. Btw, were you on stage at UseR! 2016 when I asked when this info would be updated?
Cheers,
Bob
You should also check out Jobs Micro. This is a leading Job search website in USA which benefits both the employees and the employers. Hope it helps you.
Hi Rajesh,
Thanks, I’ll check it out.
Cheers,
Bob
Though UK only you can easily obtain data on the trend in demand for different stats packages for free at our website http://www.itjobswatch.co.uk. Drop me a line if you need any help/have any comments. PeterH
Hi Peter,
That’s a nice way to show popularity!
Thanks,
Bob
As an academic, I was particularly fascinated by your graphs showing the number of scholarly publications (in Google Scholar) mentioning specific data analysis packages versus publication year. In particular, the sharp decline since 2008 in papers mentioning SPSS was striking.
It would be interesting to compare the trends in Google Scholar with those in PubMed. Although PubMed focuses on the biomedical literature, I have used it to find citations in physical sciences and engineering as well. In my own biomedical field, I have noticed anecdotally that many authors cite GraphPad Prism and/or Origin or OriginPro for their statistical analyses, but terms such as “Origin” and “Prism” are used in so many ways, it is difficult to search for their use in data analysis. Likewise, it is difficult to search for “R” as a specific data analysis term. “JMP” also presents difficulties, as it is used as an acronym for a variety of biomedical terms.
In any event, I ran a quick and very imprecise PubMed search for terms that are relatively specific for statistical/data analysis packages and got the numbers of hits shown below. I was able to make the search for GraphPad Prism relatively specific by using both terms (this results in an underestimate, because some researchers only mention “Prism” and a version number).
The first number for each package is for all records in PubMed; the second number is for the past five years; the third number is the 5-year/all-time ratio:
SPSS: 22617; 14618; 0.646
SAS: 12494; 5250; 0.420
Matlab: 4930; 2593; 0.526
Stata 4569; 3686; 0.807
Statistica: 1125; 510; 0.453
GraphPad Prism: 303; 246; 0.812
Minitab: 221; 106; 0.480
Systat: 89; 32; 0.360
It is interesting to see how GraphPad Prism and Stata differs from the others with respect to having the largest fractions of hits in the last five years.
GraphPad Prism has been my “go to” package for routine statistics and graphing for many years — in my opinion, it is by far the most intuitive statistics package available for the bench scientist.
For more advanced procedures, I’ve started using Stata relatively recently, and I have been very favorably impressed. From my perspective, it has an excellent coverage of techniques, superb documentation, caring customer support, and an active user base. it is more difficult to learn than strictly menu-driven packages such as SPSS or Statistica, but much easier to learn than Matlab or R. Overall, there is an elegance about Stata that I appreciate, and I am glad to see that its apparent rate of growth in academic publications is quite respectable.
Hi Rudy,
Thanks very much for providing that interesting data! I’ve heard of GraphPad Prism but I was unaware of how prevalent its use has become. I have noticed that both Origin and SigmaPlot have added statistical methods, but so far I haven’t followed them due to the difficulty of separating that out from general graphics use. What did you end up using as a search string for GraphPad Prism? Does PubMed include articles in Italian? If so, did you correct for “stata” being a common word in Italian? (If you haven’t see my search details, they’re here: http://r4stats.com/articles/how-to-search-for-data-science-articles/).
I am very impressed by Stata’s conciseness, internal consistency, extensiblility, and general ease of use of use. Its ability to analyze complex samples across many of its procedures is particularly impressive.
I’m sure that we could pick other fields such as marketing, where SPSS might still dominate, or economics, were Stata might be the top one.
Cheers,
Bob
Hi Bob,
Thanks for your reply to my comment.
Yes, in my field, GraphPad Prism is quite popular. Most researchers I know use it for its combination of statistical procedures and graphics. Few if any appear to use it only for graphics (although I have not done a rigorous survey).
In addition, my colleagues in physical sciences and engineering (and I) use Origin or OriginPro in like manner to those who use GraphPad Prism — data analysis in combination with graphics, but not graphics in isolation.
Indeed, some software presents problems of categorization. OriginPro includes such things as signal processing, and Matlab has even broader coverage, especially including its various toolboxes and links to simulations via Simulink.
Speaking of linkages, OriginPro has consoles/links to Origin C, Labtalk, Python, Mathematica, Matlab, and R. Statistica has a link to R, and Matlab has R-link through its file exchange. This makes it difficult to separate “pure” usage of the parent program from using it as a front-end for other programs such as R.
Regarding search strings, for Prism, I used “Graphpad AND Prism”. This will result in some degree of under-representation, because some people cite the program as “Prism 6.03”, etc., without mentioning GraphPad. I didn’t attempt to find hits for Origin, which is variously cited as “Origin”, “OriginPro” “Origin Pro” or “OriginLab(s)”.
As for Stata, I did not correct for the Italian use of “stata” (past tense of “to be”, i.e., “was”). It would be more common to pick up nouns, but the closest noun in Italian (as far as I know) is “stato”. I checked the total number of PubMed hits for “stata” for articles written in Italian — there were only 82, and a quick scan of them indicated that these hits were due to the software Stata rather than Italian for “was”.
SigmaPlot includes some statistical procedures, but it also has a companion program, SigmaStat. My impression is that these programs have not been very actively developed for the past several years, and scientists have tended to look elsewhere for scientific data analysis and graphing. A quick PubMed search for SigmaStat turned up 51 hits; Sigmaplot had 56.
I’ve been searching for a data analysis package to turn to when GraphPad Prism or OriginPro are insufficient, and thus far I’ve narrowed it down to Stata and R. Between these two, Stata seems more “natural” to me. On the other hand, I recognize the many advantages or R, and I feel an obligation to myself to overcome the problems with its steep learning curve.
Great read. Took 2 coffees and several hours to absorb all of this yesterday, I had no criticism whatsoever. Very well done. However. Getting back into the work I do today I had a realisation. In all of this research and analysis did you encounter yourself while practicing or even see it during your research? The topic of Arbitrary Precison Arithmetic. In R I struggle with it consistently every time I perform arithmetic on decimals such as money during visualisation and analysis, and most importantly during simple logistic regression!
I tend to rely on R for the tools but the same task in Python2 yields more accurate results consistently then R. Verified using a basic calculator! Don’t underestimate the mere calculator. R has great tools but fundamentally flawed without having implemented arbitrary precise arithmetic. R may be “faster” due to its raw use of floating point calculations but it lack accuracy due to it and many a time I’ve discredited my own findings with R using a calculator and more importantly I’ve shown that 6 months of work others have done yielded inaccurate results simply because they don’t know to account for arbitrary precise arithmetic.
Hi! You mentioned that “John Fox (2009)” analyzed capabilities of the R language but I didn’t see the source in your bibliography. I was curious if you had that source available? Also, do you have a notebook either on on rpubs or in Github that show the data you used to generate the plots? I’m currently researching popularity metrics and would love to be able to reproduce some of your results in different contexts.
Hi Augustina,
Thanks for pointing that out. I’ve added a link to John’s article:
https://www.jstatsoft.org/article/view/v073i02/v73i02.pdf
Sorry, I don’t have that work on Github. I wish I were that organized! There are so many pieces that it takes me quite a while to find each when I do the annual updates.
Cheers,
Bob
Just an FYI that the “John Fox (2009)” you’ve linked to within the text is actually “John Fox (2016)” since it refers to a 2016 article. Also a great read, though.
Hi hblanks,
Thanks for the correction!
Cheers,
Bob
Bob,
If you are not already tracking “Orange”, I would invite you to do so. As you probably know, it is a “data mining” platform based on Python and Python Script in a KNIME-like interface. It emphasizes interactive data visualization and visual programming, and it appears to be gaining in popularity.
https://orange.biolab.si/
Thanks.
Best regards,
Rudy
Hi Bob: Now that it has been some time since you’ve added GraphPad Prism to your software list, I would very much like to see you to add OriginLab’s Origin Pro to the mix. Origin Pro represents a large step upward from Prism in data analysis capabilities — it is more of a competitor for Matlab, not as complete, but much easier to use.
Hi there
Just wanted to mention one tiny typo: the figure 8a caption refers to the left column twice.
Cheers
Dear Stephanie,
Thanks very much for reporting that typo! It’s fixed.
Cheers,
Bob
Dear Bob,
Thank you for this article and its many updates!
It would be awesome to see Figures 2d and 2e combined in one, using a log scale for the count. I find it a bit problematic leaving SPSS totally and SAS almost out of the Fig.2e. It is also disturbing to have different colors for the labels, e.g., for R in those two figs. (Only one figure would obviously fix the latter problem.)
Just asking. Sharing the data behind those figures would be a good alternative.
By the way, just above Fig.2e there is a tiny typo: “for 2014 and 1015” (should be “for 2014 and 2015”, of course).
With best wishes,
Kimmo Vehkalahti, Helsinki, Finland
@KimmoVehkalahti
Hi Kimmo,
Thanks for catching that typo! I fixed it, but it’ll take a bit to update through the various servers.
I used to include a log plot, but then I showed it to a few professional statisticians and asked them to read it and tell me how close R was to passing SPSS. Even though they use log transformations regularly, their perception was far off the mark, so I figured your average reader would also fail to read it correctly, and I dropped it. Apparently “replies” don’t take images, so I tweeted it to you.
Cheers,
Bob
There’s something a little strange about Figure 2d. If you add up all the curves, it appears that the total mentions of *any* statistical package have declined threefold since 2009. Do you believe that? Seems like some kind of artifact.
Hi Ptvonhippel,
As I mention under figure 2e, “Note that the decline in the number of articles that used SPSS, SAS, or Prism is not balanced by the increase in the other software shown in this particular graph. Even adding up all the other software shown in Figures 2a and 2b doesn’t account for the overall decline. However, I’m looking at only 58 out of over 100 data science tools.” So yes, I think it’s an artifact of the incredible diversity of options that people now have to analyze data.
Cheers,
Bob
I recently found Neural Designer and have been using it as my go-to tool. I find it really easy to use and there is no need for programming when building my predictive models.
Let me know if you check it out Bob.
Hi Robert,
I looked at it briefly. I’ll check it out next time I gather some stats & see if it’s getting enough traction to include. There are so many!!
I noticed a minor typo under “Examples> Training Strategy” it has “How to adjust the network [parameteres].”
Cheers,
Bob
Hi Bob,
Thank you for putting this together and keeping it updated! It’s very useful evidence to put in front of my colleagues and bosses to help nudge them toward ‘picking the right coding language for the office’ (yes, most of my colleagues still use Excel – but we dont work with too giant of datasets so its not too horrifyingly awful).
My question is this: would you feel comfortable putting your search result counts in a csv or google sheet for others to explore? I’d love to be able to make my own visuals using the search return data for google scholar hits (especially to compare SPSS, SAS and R in recent years), however, I’m not sure I’m able to follow your brief instructions on how you searched. I would like to use that information in a deck for my office, arguing that we need to capacitate more people on R to actually do good analysis. I’d use this data to show that R is/is becoming an industry standard and that to do good/relevant work, we don’t need to pay for SAS/SPSS (we’re an NGO).
Thanks a million!
Cheers,
Laura
Hi Laura,
I’ve gotten busy and have not updated that data in two years. I hope to do so this March. Unfortunately, due to the dynamic nature of the Google algorithm, you need to start from scratch each time, which is why I only go back a few years now. The article I reference does include the precise search strings though. Each time I collect new data, I check the results of each search carefully to make sure no irrelevant hits are getting added since I last collected data. It is *very* time-consuming!
Cheers,
Bob
Long time reader Bob. I appreciate the work you put into article over many years.
I recently saw https://i.redd.it/3p3dct1b86081.png which was created via Facebook/Meta job ads.
I wondered if you were going to update Figure 1a soon. I thought it would be interested to see if there is a pattern in job title.
Hi Angela,
Thanks for pointing that out, it should be helpful in updating my searches. I’m way behind on other projects, but I do hope to update that data in the coming year.
Cheers,
Bob