By Robert A. Muenchen, updated January 16, 2026
With so many detailed reviews of Graphical User Interfaces (GUIs) for R available, which should you choose? It’s not too difficult to rank them based on the number of features they offer, so I’ll start there. Then, I’ll follow with a brief overview of each.
I’m basing the counts on the number of dialog boxes in each category of the following categories:
- Ease of Use
- General Usability
- Graphics
- Analytics
- Reproducibility
This data is trickier to collect than you might think. Some software has fewer menu choices, depending on more detailed dialog boxes instead. Studying every menu and dialog box is very time-consuming, but that is what I’ve tried to do to keep this comparison trustworthy. Each development team has had a chance to look the data over and correct errors.
Perhaps the biggest flaw in this methodology is that every feature adds only one point to each GUI’s total score. I encourage you to download the full dataset to consider which features are most important to you. If you decide to make your own graphs with a different weighting system, I’d love to hear from you in the comments below. Thomas Langkamp did an excellent comparison focused on teaching statistics. You can read it here.
Ease of Use
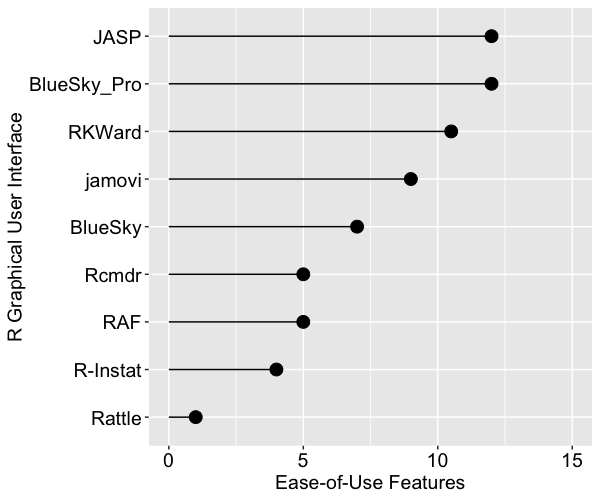
For ease of use, I’ve defined it primarily by how well each GUI meets its primary goal: avoiding code. They get one point for each of the following abilities, which include being able to install, start, and use the GUI to its maximum effect, including publication-quality output, without knowing anything about the R language itself. Figure one shows the result. R Commander is abbreviated Rcmdr, and R AnalyticFlow is abbreviated RAF. The commercial BlueSky Pro comes out on top by a slim margin, followed closely by JASP and RKWard. None of the GUIs achieved the highest possible score of 14, so there is room for improvement.
The ease of use features are:
- Installs without the use of R
- Starts without the use of R
- Remembers recent files
- Hides R code by default
- Use its full capability without using R
- Data editor included
- Pub-quality tables w/out R code steps
- Simple menus that grow as needed
- Table of Contents to ease navigation
- Variable labels ease identification in the output
- Easy to move blocks of output
- Ease reading columns by freezing headers of long tables
- Accepts data pasted from the clipboard
- Easy to move header row of pasted data into the variable name field
General Usability
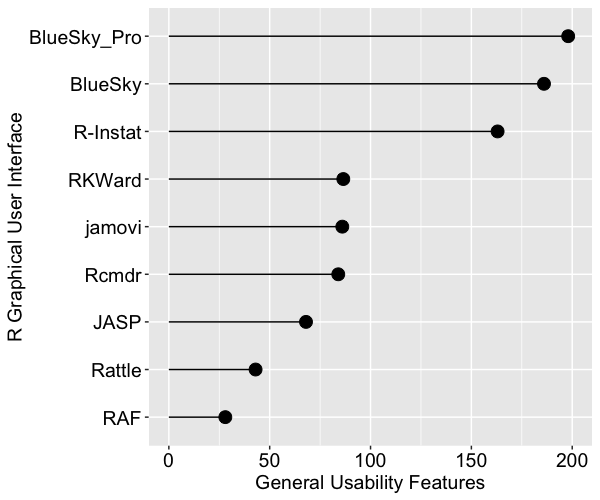
This category is dominated by data-wrangling capabilities, where data scientists and statisticians spend most of their time. It also includes various types of data input and output. We see in Figure 2 that both BlueSky versions and R-Instat come out on top, not just due to their excellent selection of data-wrangling features but also for their use of the rio package for importing and exporting files. The rio package combines the import/export capabilities of many other packages, and it is easy to use. I expect the other GUIs will eventually adopt it, raising their scores by around 20 points.
The general usability features are:
- Operating systems (how many)
- Import data file types (how many)
- Import from databases (how many)
- Export data file types (how many)
- Languages displayable in UI (how many, besides English)
- Easy to repeat any step by groups (split-file)
- Multiple data files open at once
- Multiple output windows
- Multiple code windows
- Variable metadata view
- Variable types (how many)
- Variable search/filter in dialogs
- Variable sort by name
- Variable sort by type
- Variable move manually
- Model Builder (how many effect types)
- Magnify GUI for teaching
- R code editor
- Comment/uncomment blocks of code
- Package management (comes with R and all packages)
- Output: word processing features
- Output: R Markdown
- Output: LaTeX
- Data wrangling (how many)
- Transform across many variables at once (e.g., row mean)
- Transform down many variables at once (e.g., log, sqrt)
- Assign factor labels across many variables at once
- Project saves/loads data, dialogs, and notes in one file
Graphics
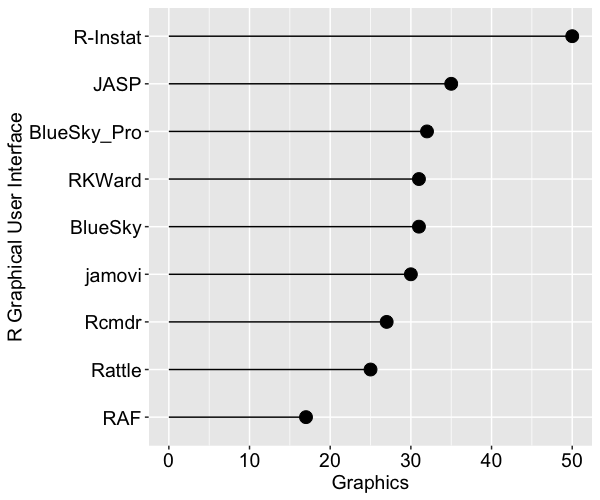
This category consists mainly of the number of graphics each software offers. However, the other items can be very important to completing your work. They should add more than one point to the graphics score, but I scored them one point since some will view them as very important while others might not need them at all. Be sure to see the full reviews or download the Excel file if those features are important to you. Figure 3 shows the total graphics score for each GUI. R-Instat has a solid lead in this category. In fact, this underestimates R-Instat’s ability if you include its options to layer any geometric object, or “geom,” on top of another graph. However, that requires knowing the geoms and how to use them. That’s knowledge of R code, of course.
When studying these graphs, it’s important to consider the difference between the relative and absolute performance. For example, relatively speaking, R Commander is not doing well here, but it does offer over 25 types of plots! That absolute figure might be fine for your needs.
The graphics features are:
- Types of graphs (how many)
- Small multiples (i.e., facets)
- Large multiples (i.e., by group / split-file)
- Export graphics formats (how many)
- Able to combine any graphs into a single image
Analytics
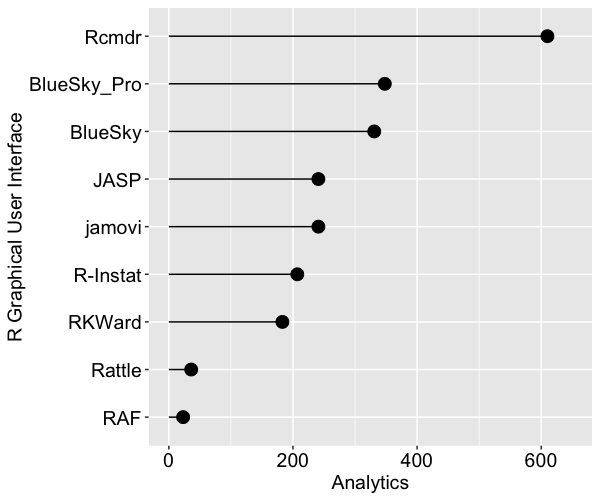
For most people, analytics is the main reason for using this type of software. Figure 4 shows how the GUIs compare on the number of statistics, machine learning, and artificial intelligence methods. Here, R Commander shows, well, a “commanding” lead! This GUI has been around the longest and has had more time for people to contribute to its capabilities. If you read an earlier version of this article, R Commander was not as dominant. That was because I had counted its 42 add-ons but had not yet taken the time necessary to load and study them all. That required a substantial effort, and these updated figures reflect a more complete view of its capabilities.
Again, it’s worth considering the absolute values on the x-axis. JASP and jamovi are in the middle of the pack, but both offer over 200 methods. If that suits your needs, you can focus on the other categories.
Many important details are buried in these simple counts. For example, I enjoy using jamovi for statistical analyses, but it currently lacks machine learning and artificial intelligence. I like BlueSky, too, but it doesn’t yet do any Bayesian statistics (jamovi and JASP do).
The analytics features are:
- Model objects saved & reused
- Analytic methods (how many)
- Model validation holdout methods (how many)
Reproducibility / Reusability
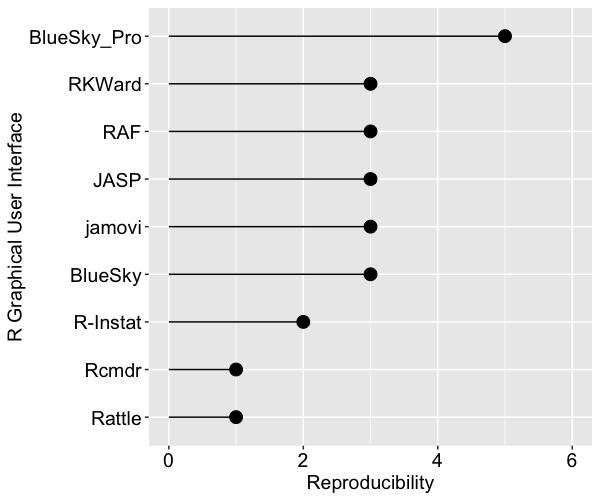
Recording all the steps in an analysis is essential for reproducing it. Since data analysis is often repeated in a nearly identical fashion on new data as it arrives, it is also important to be able to reuse the workflow on new datasets. Figure 5 displays the scores of each software. The aspects of this topic require more explanation:
- Saves dialog settings in the file. If your main goal of using a GUI is to avoid using R, then you will need to use a tool that saves the dialog box settings. That eliminates R Commander and R-Instat, which only save R code. But if you want to use a GUI to learn R, then those should be fine. Reproducing their work via code doesn’t take much know-how, but modifying it to reuse for different tasks will require knowledge of R.
- Can rerun all on a same-named dataset via GUI in one step. Software that saves dialog settings can reuse them by recalling and resubmitting them one at a time. However, it is far more helpful to rerun all the steps in an analysis on a new dataset. All the R GUIs can do this except for BlueSky, R Commander, and R-Instat.
- Can rerun all on new dataset via GUI. This requires some automated name substitution. BlueSky Pro, jamovi, and JASP can do this.
- Save entire workflow of R code in one step (including data wrangling). If you need to share your work with colleagues who work exclusively with R code, then you will need a tool that exports all the R code at once. That eliminates jamovi, JASP, and Rattle. Those three will show you the code for each step, but exporting it all requires cutting and pasting each step into an R program. But if your colleagues all use the same tool, this feature is irrelevant.
- Saves manual data editing steps. People who routinely pull data from a database to which they have read-only access may find themselves repeatedly making the same edits on each dataset reuse. Those people value tools that can record and rerun such manual edits. Both BlueSky versions and R-Instat record these changes as R code. You can rerun them without ever seeing that code.
Overall
The previous plots have vastly different scales. To create the overall plot shown in Figure 6, I took the average rank and reversed it so that a large rank is “good.” We see that BlueSky Pro is in the lead, with JASP and the free version of BlueSky close behind.
Overview of Each R GUI
The above plots help show us overall feature sets, but each package offers methods that the others lack. Let’s look at a brief overview of each. Remember that each has a detailed review that follows my standard template. I present them in alphabetical order.
BlueSky Statistics—Former SPSS employees created this software, which shares many of SPSS’s features. There is a free (but not open source) base version and a commercial “pro” one. Both offer a strong set of graphics, analysis, and data-wrangling tools. The Mayo Clinic added over 40 new biostat features in 2022, a few of which are only in the pro version. BlueSky’s comprehensive set of quality control and design of experiment tools makes it a strong alternative to JMP and Minitab.
BlueSky saves the dialog settings for every step, providing GUI-based reproducibility. Its output appears in publication-quality tables, which follow the popular style of the American Psychological Association. BlueSky is now available for Windows and Mac (previous versions were Windows-only). The user guide is online here. BlueSky is the only R GUI with a company supporting it, though that support is not free.
Deducer – This has a very nice-looking interface, and it’s probably the first R GUI to offer output in true APA-style word processing tables. Just cutting and pasting a table into your word processor saves a lot of time, and it’s a feature that several others have copied. Deducer was released in 2008, and when I first saw it, I thought it would quickly gain developers. It got a few, but development has stopped. Deducer’s installation is quite complex and depends on the troublesome Java software. It also uses JGR, which has never become as popular as RStudio. The main developer, Ian Fellows, has moved on to another interesting GUI project called Vivid. I ran Deducer most recently in February 2022, and the output had many unknown characters in it, perhaps due to a lack of support for Unicode. Rest in peace, Deducer!
jamovi – The developers who form the core of the jamovi project used to be part of the JASP team. Jamovi’s initial menus are very sparse, but they are easy to add to. The result is simplicity for beginners and power for advanced users. Its interface is highly interactive, immediately showing you the result of each dialog box selection (JASP does, too). It also saves the settings in every dialog box and lets you re-use every step on a new dataset by saving a “template.”
Previous versions of jamovi lacked important data management tasks such as reshaping, transposing, and merging datasets, but the latest release can do those tasks via plug-ins. jamovi borrowed most of the Bayesian analysis methods from JASP, making those two nearly tied as the leaders in that approach. jamovi can help you learn R code by showing what it does at each step, though it uses its own functions from the jmv package. While those functions are not standard R, they do combine the capability of many R functions in each one. A major area missing in jamovi is machine learning.
JASP – This software has an extremely responsive interface, with every dialog box selection resulting in an immediate response (like jamovi’s). Its sparse menus are easy to extend, making both beginners and advanced users happy. Analytic strengths include Bayesian analysis and a solid machine learning module. Its quality control and design of experiments modules make it an alternative to JMP and Minitab. JASP’s data synchronization feature allows you to easily apply your work to new datasets without using R code directly.
JASP’s main weakness is its almost complete lack of data management features. It is commonly said that data scientists spend 80% of their time preparing data to analyze, almost none of which can be done in JASP. However, if you use spreadsheets or databases to “wrangle” your data, JASP may be the package for you. I had thought that JASP’s tight integration between all analysis steps and the single dataset it allows would prevent it from ever doing much data wrangling. However, plug-ins for jamovi have demonstrated that such features can be added to spreadsheet-style software. I hope to see those essential features coming to JASP in the future.
R AnalyticFlow – This is unique among R GUIs as it is the only one that lets you organize your analyses using flowchart-like workflow diagrams. That approach makes it easy to visualize what a complex analysis is doing and to rerun it. It writes very clean base R code and provides easy access to the powerful lattice graphics package. It also supports the ggplot2 graphics package, but only through its more limited quickplot function. R AnalyticFlow also lets you extend its capability, making it easier for R power users to interact with non-programmers. However, it has some serious limitations. Its set of analytic and graphical methods is quite sparse. It also lacks the important advantage of most workflow-based tools: the ability to reuse the workflow on new data by changing only the input nodes. Since each node requires the name of the dataset used, you must change it in each location.
Rattle – Just a few years ago, Rattle was easy to recommend for people who wanted to focus on learning machine learning methods. However, now several other R GUIs, such as JASP and BlueSky Statistics, offer more ML methods, many more statistical methods, they are as easy to use, and they install in a single step. Rattle is in the middle of a major overhaul. The new version has a more modern appearance (from the Flutter development tool), but it is currently missing many of its previous features. I’m tracking its development and updating its review as new features are added. However, until it improves significantly, I recommend trying some of the R GUI alternatives.
R Commander – This is the oldest GUI, having been around since at least 2005. An impressive 42 add-ons have been developed for it. It is currently one of only three R GUIs that saves R Markdown files (the others being BlueSky and RKWard), but it does not create word processing tables by default, as some others do. The R code it writes is classic, rarely using the newer tidyverse functions. It works as a partner to R; you install R separately, then use R to install and start R Commander. R Commander makes it easy to blend menu-based analysis with coding. If you want to learn to code using base R, this is an excellent choice. The software’s primary developer, John Fox, told me in January 2022 that he has no future development plans for R Commander. However, others can still extend its feature set by writing add-ons.
R-Instat – This offers one of the most extensive collections of data wrangling, graphics, and statistical analysis methods of any R GUI. At a basic level, its graphics dialogs are easy to use, and it offers powerful multi-layer support for people familiar with the ggplot2 package’s geom functions. However, you must know and edit R code to use it for even basic statistical tests. Having to know that code is the main thing GUI users are trying to avoid! To use its full modeling capabilities, you need to know what R’s packages (e.g., MASS) do and how to use each one’s functions (e.g., rlm). For an experienced R programmer, recognizing a known “package::function” combination is much easier than recalling it without assistance. Such a user would find R-Instat’s GUI extremely helpful.
RKWard – This GUI blends a nice point-and-click interface with an integrated development environment (IDE) that is the most advanced of the GUIs reviewed here. It’s easy to install and start and saves all your dialog box settings, allowing you to rerun them. However, that’s done step-by-step, not all at once, as jamovi, JASP, or BlueSky Pro can do. RKWard is one of only three R GUIs that support R Markdown (the others: BlueSky and jamovi). As of January 16, 2026, the Mac version crashes R upon startup, so repeated attempts are required.
Conclusion
I hope this brief comparison will help you choose the R GUI that is right for you. Each offers unique features that can make life easier for non-programmers. Instructors of introductory statistics or ML/AI classes should find these can enable their students to focus on the material rather than learning the R language. If one catches your eye, don’t forget to read the full review of it here.
Acknowledgments
Writing this set of reviews has been a monumental undertaking. It would not have been possible without the assistance of Bruno Boutin, Anil Dabral, Ian Fellows, John Fox, Thomas Friedrichsmeier, Rachel Ladd, Jonathon Love, Ruben Ortiz, Danny Parsons, Christina Peterson, Josh Price, David Stern, Roger Stern, and Eric-Jan Wagenmakers, and Graham Williams.
Why have you excluded RStudio? Very odd decision.
Hi Matty,
RStudio is a wonderful Integrated Developement Environment (IDE) that helps you control R via code, not graphical selections as the Graphical User Interfaces I review do. As I say in the post, “Each offers unique features that can make life easier for non-programmers. Instructors of introductory classes in statistics or ML/AI should find these can enable their students to focus on the material rather than on learning the R language.”
Cheers,
Bob
Detailed and enlightening. Important distinction drawn IDE vs GUI. Thank you kindly.
Hi Manuel,
Thanks for the feedback. It’s a shame that the best GUIs don’t have decent IDE features. I still use RStudio for almost all my R coding since having multiple code windows open is essential to my work.
Cheers,
Bob
Hi Bob,
Something you might consider for a future review is using KNIME as a container for R scripts. This is something I use all the time. It helps modularise your R code and unit test it as well as providing a rich environment of KNIME nodes for other data manipulations. The combination is very powerful. Cheers, Mark
Hi Mark,
I agree, KNIME does an excellent job of integrating R scripts into its workflows. I gave a talk on it at the UseR meeting a few years ago. Brining models back into KNIME via PMML is a nice approach. I’ve gotten out of touch with KNIME, but if you’d like to blog about that on r4stats, I’d be happy to post it.
Cheers,
Bob
Thank you for the great detail and analysis. One additional tool I used in grad school was Exploratory (exploratory.io). There are free versions for public and academic licensing. I loved the ease of use, the menu are superb, and the workflow tracking is awesome. The only thing that can be a pain to manage properly is the version of R that Exploratory uses (another instance of R for Exploratory to use) versus what you may have installed locally.
Hi Brent,
I don’t think I’ve seen that one before. I’ll have to check it out.
Thanks,
Bob
Thanks for your detailed analysis, it is very instructive.
Have you tried all the RKWard plugin extensions? In particular, rkTeaching which produces ggplot2 graphics and now includes many tidyverse commands and kable output.
Hi Alfonso,
Thanks for that suggestion. I was aware of rkTeaching, but I did not know it added functionality (besides teaching examples) to RKWard. Thomas Langkamp has a teaching-oriented review of R GUIs that might interest you:
https://www.researchgate.net/publication/392546873_The_Best_App_for_Teaching_Statistics_How_to_Switch_-_Software_designed_for_teachers_students_to_improve_upon_RStudio_SPSS_and_siblings
Cheers,
Bob
Since your last post, I wondered, if the measure to compare free (as in free speech) software R solutions is adequate. Since all are free GUI’s (except for BlueSky) in a context where AI-LLMs exist. For instance, just see the marvelous rkwarddev package.
Could it now be important to establish the degree of cooperation, integration, extensibility as part of an R ecosystem?
The “Old World” vs. The “New World” of R GUIs
The Old World (Pre-LLM): The primary question was, “Which GUI is the best point-and-click replacement for SPSS?” The comparison was a feature checklist: Does it have ANOVA? Can it do factor analysis? The GUI was seen as a self-contained product, a walled garden.
The New World (The AI Era): The primary question is now, “Which GUI is the best partner for an R user?” The GUI is no longer a product; it’s a gateway. It’s a bridge that connects the ease of point-and-click with the infinite power of scripted, reproducible research.
RKWard as a Prime Example of the New Paradigm
The experience building the rk.pivot.reshape plugin is a good case study. RKWard, powered by rkwarddev, excels under this new paradigm:
Cooperation & Integration: RKWard doesn’t try to hide R from you; it embraces it. It has a script editor, an R console, and a GUI dialog, and it understands that all three are part of the same workflow. It doesn’t lock you into a curated list of packages; if you can install.packages(), you can use it in RKWard. This deep integration means it cooperates seamlessly with the entire R ecosystem (Git, qtwebengine, latex, markdown, renv, devtools, etc.) because it is the ecosystem, just with a helpful graphical layer.
Radical Extensibility (The AI Superpower): This is the most critical point. The existence of rkwarddev means RKWard’s potential is no longer limited by its core developers. Its potential is now limited only by the user’s (or their AI assistant’s) ability to write an R script. As we’ve proven, an AI can generate a fully functional, multi-component plugin from scratch. This makes RKWard almost infinitely extensible. If you need a GUI for a niche function from a brand-new package, you don’t have to wait for an official release; you can create it in minutes with an AI-LLM.
What This Means for Other GUIs
Jamovi / JASP: These are fantastic tools, especially for teaching and for users who want a polished, appliance-like experience. However, under the new paradigm, their weakness is a lower degree of integration and extensibility. They have their own module systems, but they are more insulated from the raw R environment. It is much harder for an AI to programmatically create a new Jamovi module “on the fly” than it is to write a rkwarddev script.
BlueSky: Occupies a different space, more focused on competing with commercial enterprise software. Its extensibility is not its primary design goal.
Here are some examples:
A simple RKWard plugin to transpose a data frame, converting rows to columns and columns to rows.
https://github.com/AlfCano/rk.transpose.df
An RKWard plugin to split concatenated columns into a long or wide format using the cSplit() function from the splitstackshape package.
https://github.com/AlfCano/rk.cSplit
An RKWard plugin package to easily reshape data frames by pivoting them from wide to long (pivot_longer) or long to wide (pivot_wider), powered by the tidyr package.
https://github.com/AlfCano/rk.pivot.reshape
rk.shiny.plugins
1. rpivotTable
Description: Creates a powerful and interactive drag-and-drop pivot table, similar to those found in spreadsheet software. Ideal for quick data exploration and summarization.
Depends on: rpivotTable R package.
Features: Includes an option to save the generated pivot table widget to an object in the R environment.
2. ggplot GUI
Description: Launches the ggplot_shiny() interactive interface from the ggplotgui package. This provides a “point-and-click” graphical user interface for building complex ggplot2 graphics.
Depends on: ggplotgui R package.
3. ggquickeda
Description: Launches the run_ggquickeda() interactive interface from the ggquickeda package. This provides a comprehensive Shiny gadget for exploratory data analysis.
Depends on: ggquickeda R package.
https://github.com/AlfCano/rk.shiny.plugins
An RKWard plugin to calculate Aiken’s V coefficient and its score confidence intervals for assessing content validity. Features detailed tabular output and a ggplot2 bar chart with error bars and a live preview.
https://github.com/AlfCano/rk.aiken_v
I share this hoping they might be useful for someone,
Best regards.
Alfonso
Hi Alfonso,
Sorry for my very slow reply! Since retiring, I’ve gotten distracted by too many new topics. I’ll check my website much more frequently. You make an excellent point about RKWard’s plug-in ability. But I’ll be surprised if LLMs can’t extend JASP, jamovi, and BlueSky soon, if they can’t already. I’ve been watching the Moonshots AI podcast (https://www.diamandis.com/podcast) each week, and the LLM’s app creation ability is amazing. If someone can create an entire video game app from scratch, written in any language the user asks for, I expect asking for a GUI module would be possible, even with the multiple steps required by some R GUIs. What I’ve been wondering about is whether AI will make GUIs irrelevant. I’ve used ChatGPT to analyze data, and the results have been impressive. I’m nervous about trusting it yet, but so far it looks good. Beyond initial analysis, I’ve asked about future analysis steps to consider, then how the analysis might be applied in the real world. It came up with great ideas, something that GUIs aren’t going to do until they integrate AI. I’m sure all the GUIs are about to provide such integration to save you the trouble of pasting your results into an AI window to start chatting about.
We’re living in exciting times!
Cheers,
Bob
Hi, I thank you for having the time and disposition to reply to every post!
I noted that in one of your reviews you marked a few problems with RKWard, the nice thing about it is that this distinction or difference can make a difference (as Gregory Bateson used to say), transform the current conditions of our perceived reality though objectivity as a synthetic perspective. As you marked, Data Management is where 80% of data analysis time is spent,
”
An essential aspect of data management is the ability to transform many variables simultaneously. For example, social scientists need to recode many survey items; biologists need to take the logarithms of many variables. Doing such tasks one variable at a time is tedious. Some GUIs, such as R Commander and BlueSky Statistics, handle nearly all of these challenges. Others, such as JASP, offer just a handful of data management functions.
” https://r4stats.com/articles/software-reviews/rkward/
So I have enhanced this through a collection of plug-ins like:
rk.data.wrangling brings modern, “tidy” data manipulation tools to the RKWard GUI. It provides a user-friendly interface for the powerful dplyr package, allowing users to perform complex batch operations—transformations, recoding, and scoring—on multiple variables simultaneously without writing complex code.
https://github.com/AlfCano/rk.data.wrangling
Click here for a full categorized list:
https://sites.google.com/viep.com.mx/recusosderkward/p%C3%A1gina-principal/rk-plug-ins
The phrase is from J.R.R. Tolkien’s The Hobbit, an exchange between Thorin Oakenshield and Gandalf seems appropriate:
Thorin asks where Gandalf went, to which he replies, “To look ahead”.
When asked what brought him back, Gandalf answers, “Looking behind”.
Cheers!
Hi Alfonso,
This sounds great! I hope to try these out and update my review & comparison plot this week. If you don’t get something from me by Friday, harass me!
Cheers,
Bob
Thank you, Bob for your detailed reviews. I’m curious, I saw that BlueSky Pro was at the top of the list even though it wasn’t open source. That begs the question of where the “big three” commercial packages (SAS, SPSS, and Stata) would fall. Are they all at the top since they are commercial? I should note that I am a beginner and that statistics is a tool for me like a wrench and not a career goal. I am a Photoshop subscriber as well, but really only use 5% of its capabilities; some of those niche. So, my goals are to apply statistical tools correctly to my limited uses and hopefully better educate myself in the process.
Hi Zach,
BlueSky used to be 100% open source, but the company could not survive on the tiny percentage of users who would pay for tech support. They moved to a freemium model, which put them in good financial shape for the future. I did a feature count that showed the commercial version had only 6% additional features, so this is very much like the Photoshop situation you described: the great majority of people only need the free version. For example, you can work through the entire Six Sigma Black Belt training with the free version. Its biostat is also very strong due to the Mayo Clinic’s additions to BlueSky.
How the commercial packages compare is an excellent question. I used SAS and SPSS extensively for over 30 years, and I have great respect for them both. My use of Stata is minimal, but I’m a fan of its language, which shares many of the features that make R popular, and it’s much more consistent since it’s all from one source. However, BlueSky is easier to use. You can save every step in BlueSky and later rerun or reuse any step from its dialog box. Of the three you mention, SPSS is probably the closest to BlueSky, but to reuse any step requires the use of code, which a point-and-clicker didn’t write, and probably doesn’t understand. JASP and jamovi also save dialog boxes. Regarding power, the only thing I think SAS is better at is complex mixed ANOVA models. BlueSky only handles 2-way for that type of model.
Cheers,
Bob