In my neverending quest to track The Popularity of Data Science Software, it’s time to update the section on Scholarly Articles. The rapid growth of R could not go on forever and, as you’ll see below, its use actually declined over the last year.
Scholarly Articles
Scholarly articles provide a rich source of information about data science tools. Because publishing requires significant amounts of effort, analyzing the type of data science tools used in scholarly articles provides a better picture of their popularity than a simple survey of tool usage. The more popular a software package is, the more likely it will appear in scholarly publications as an analysis tool, or even as an object of study.
Since scholarly articles tend to use cutting-edge methods, the software used in them can be a leading indicator of where the overall market of data science software is headed. Google Scholar offers a way to measure such activity. However, no search of this magnitude is perfect; each will include some irrelevant articles and reject some relevant ones. The details of the search terms I used are complex enough to move to a companion article, How to Search For Data Science Articles. Since Google regularly improves its search algorithm, each year I collect data again for the previous years (with one exception noted below).
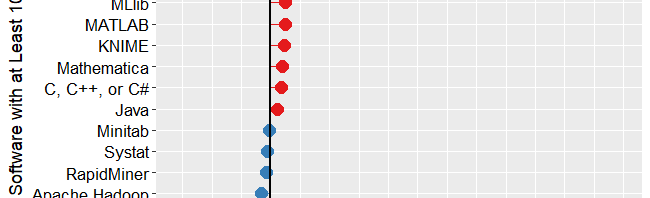
Figure 2a shows the number of articles found for the more popular software packages and languages (those with at least 1,700 articles) in the most recent complete year, 2018. To allow ample time for publication, insertion into online databases, and indexing, the was data collected on 3/28/2019.

SPSS is by far the most dominant package, as it has been for over 20 years. This may be due to its balance between power and ease-of-use. R is in second place with around half as many articles. It offers extreme power, though with less ease of use. SAS is in third place, with a slight lead over Stata, MATLAB, and GraphPad Prism, which are nearly tied.
Note that the general-purpose languages: C, C++, C#, FORTRAN, Java, MATLAB, and Python are included only when found in combination with data science terms, so view those counts as more of an approximation than the rest.
The next group of packages goes from Python through C, with usage declining slowly. The next set starts at Caffe, dropping nearly 50%, and continuing to IBM Watson with a slow decline.
The last two packages in Fig 2a are Weka and Theano, which are quite a drop from IBM Watson, though it’s getting harder to see as the lines shrink.
To continue on this scale would make the remaining packages all appear too close to the y-axis to read, so Figure 2b shows the remaining software on a much smaller scale, with the y-axis going to only 1,700 rather than the 80,000 used on Figure 2a.
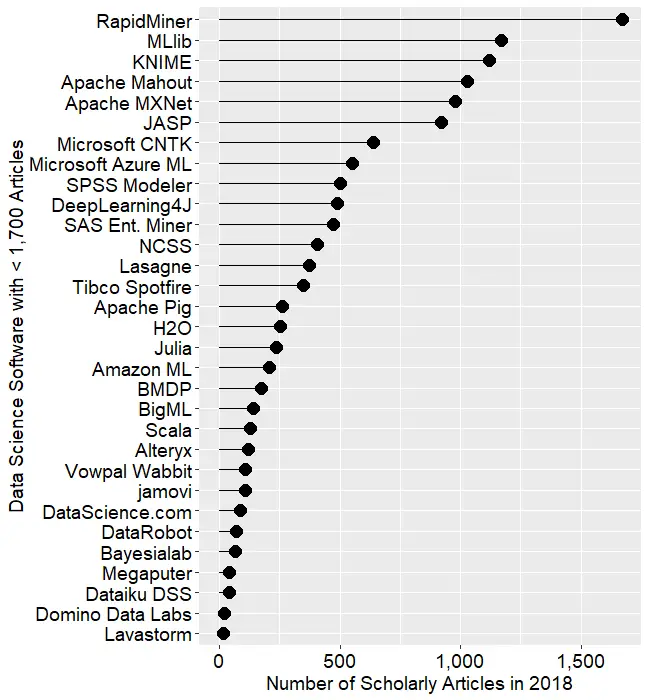
I chose to begin Figure 2b with software that has fewer than 1,700 articles because it allows us to see RapidMiner and KNIME on the same scale. They are both workflow-driven tools with very similar capabilities. This plot shows RapidMiner with 49% greater usage than KNIME. RapidMiner uses more marketing, while KNIME depends more on word-of-mouth recommendations and a more open source model. The IT advisory firms Gartner and Forrester rate them as tools able to hold their own against the commercial titans, IBM’s SPSS and SAS. Given that SPSS has roughly 50 times the usage in academia, that seems like quite a stretch. However, as we will soon see, usage of these newer packages are growing, while the use of the older ones is shrinking quite rapidly.
Figure 2b also lets us see IBM’s SPSS Modeler, SAS Enterprise Miner, and Alteryx on the same plot. These three are also workflow-driven tools which are quite expensive. None are doing as well here as RapidMiner or KNIME, tools that much less expensive – or free – depending on how you use them (KNIME desktop is free but
Another interesting comparison
Even newer on the GUI for R scene is BlueSky Statistics, which doesn’t appear on the plot at all since it has zero scholarly articles so far. It was created by a new company and only adopted an open source model a few months ago.
While Figures 2a and 2b are useful for studying market share as it stands now, they don’t show how things are changing. It would be ideal to have long-term growth trend graphs for each of the analytics packages, but collecting that much data annually is too time-consuming. What I’ve done instead is collect data only for the past two complete years, 2017 and 2018. This provides the data needed to study year-over-year changes.
Figure 2c shows the percent change across those years, with the growing “hot” packages shown in red (right side); the declining or “cooling” are shown in blue (left side). Since the number of articles tends to be in the thousands or tens of thousands, I have removed any software that had fewer than 1,000 articles in 2015. A package that grows from 1 article to 5 may demonstrate 500% growth but is still of little interest.
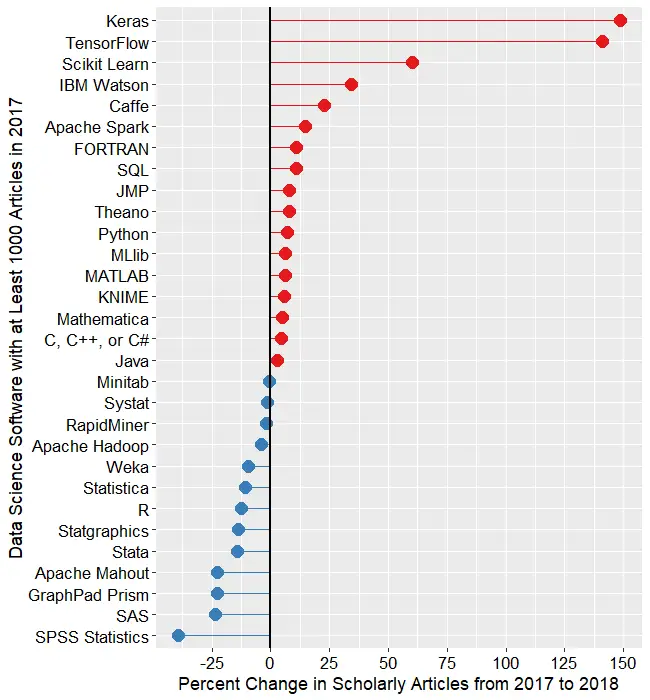
The recent changes in data science software can be summarized succinctly: AI/ML up; statistics down. The software that is growing contains none of the packages that are associated more with statistical analysis. The software in decline is dominated by the classic packages of statistics: SPSS Statistics, SAS, GraphPad Prism, Stata, Statgraphics, R, Statistica, Systat, and Minitab. JMP is the only traditional statistics package whose scholarly usage is growing. Of the machine learning software that’s declining in usage, there are rough equivalents that are growing (e.g. Mahout down, Spark up).
Of
Statistics software has been around much longer than AI/ML software, started back in the days before open source. Stat vendors have been adding AI/ML methods to their software, making them the more comprehensive solutions. The AI/ML vendors or projects are missing an opportunity to add more comprehensive statistics capabilities. Some, such as RapidMiner and KNIME, are indeed expanding in this direction, but very slowly indeed.
At the top of Figure 2c, we see that the deep learning packages Keras and TensorFlow are the fastest growing at nearly 150%. PyTorch is not shown here because it did not have enough usage in the previous year. However, its citation rate went from 616 to 4,670, a substantial 658% growth rate! There are other packages that are not shown here, including JASP with 223% growth, and jamovi with 720% growth. Despite such high growth, the latter still only has 108 citations in 2018. The rapid growth of JASP and jamovi lend credence to the perspective that the overall pattern of change shown in Figure 2c may be more of a result of free vs. expensive software. Neither of them offers any AI/ML features.
Scikit Learn, the Python machine learning library, was a fast grower with a 60% increase.
I was surprised to see IBM Watson growing a healthy 34% as much of the news about it has not been good. It’s awesome at Jeopardy though!
In the RapidMiner vs. KNIME contest, we saw previously that RapidMiner was ahead. From this plot, we that KNIME growing slightly (5.7%) while RapidMiner is declining slightly (1.8%).
The biggest losers in Figure 2c are SPSS, down 39%, and SAS, Prism, and Mahout, all down 24%. Even R is down 13%. Recall that Figure 2a shows that despite recent years of decline, SPSS is still extremely dominant for scholarly use, and R and SAS are still the #2 and #3 most widely used packages in this arena.
I’m particularly interested in the long-term trends of the classic statistics packages. So in Figure 2d I have plotted the same scholarly-use data for 1995 through 2016.
SPSS has a clear lead overall, but now you can see that its dominance peaked in 2009 and its use is in sharp decline. SAS never came close to SPSS’ level of dominance, and its use peaked around 2010.
In Figure 2d, the extreme dominance of SPSS makes it hard to see long-term trends in the other software. To address this problem, I have removed SPSS and all the data from SAS except for 2014 and 1015. The result is shown in Figure 2e.
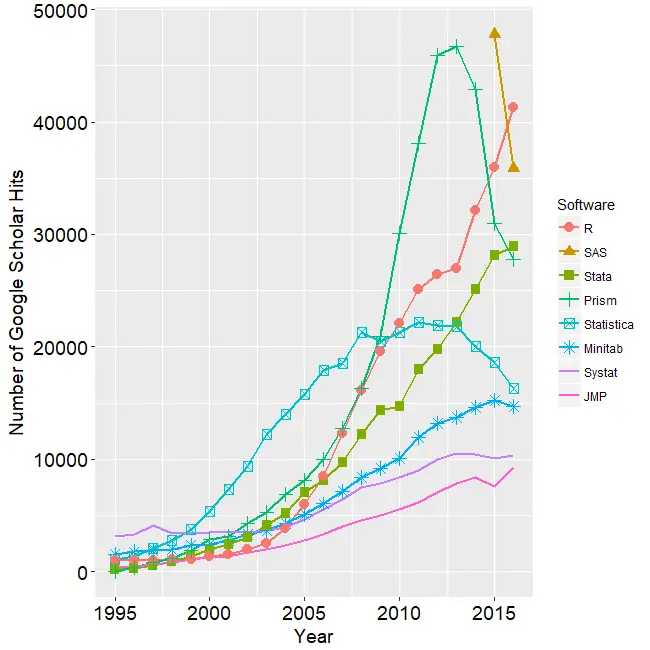
Figure 2e makes it easy to see that most of the remaining packages grew steadily across the time period shown. R and Stata grew especially fast, as did Prism until 2012. Note that the decline in the number of articles that used SPSS, SAS, or Prism is not balanced by the increase in the other software shown in this particular graph. Even adding up all the other software shown in Figures 2a and 2b doesn’t account for the overall decline. However, I’m looking at only 58 out of over 100 data science tools.
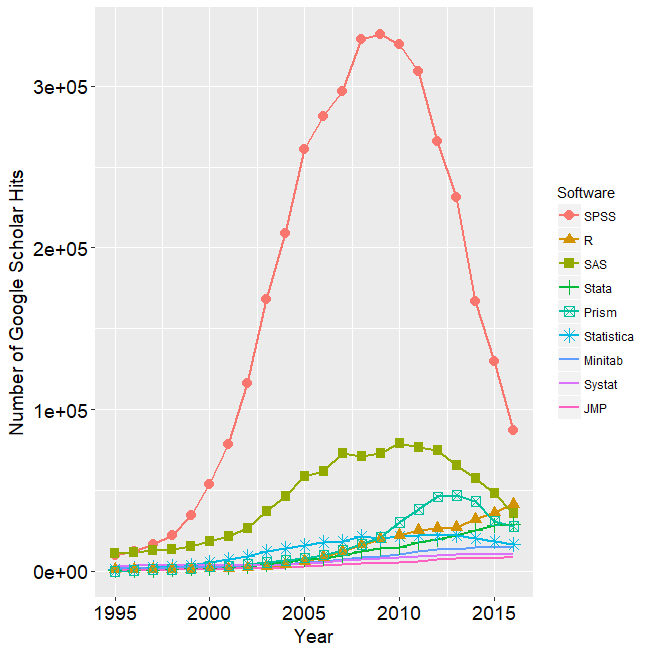
While Figures 2d and 2e show the historical trend that ended in 2016, Figure 2f shows a fresh set of data collected in
Figure 2f. The number of Google Scholar citations for each classic statistics package per year from 2015 through 2018.
In Figure 2f we can see that the downward trends of SAS, Prism, and Statistica are continuing. We also see that the long and rapid growth of R and Stata has come to an end. Growth that rapid can’t go on forever. It will be interesting to see next year to see if this is merely a flattening of usage or the beginning of a declining trend. As I pointed out in my book, R for Stata Users, there are many commonalities between R and Stata. As a result of this, and the fact that R is open source, I expect
SPSS’ long-term rapid decline has to level out at some point. They have been chipped away at by many competitors. However, until recently these competitors have either been free and code-based such as R, or menu-based and proprietary, such as Prism. With the fairly recent arrival of JASP, jamovi, and BlueSky Statistics, SPSS now faces software that is both free and menu-based. Previous projects to add menus to R, such as the R Commander and Deducer, were also free and open source, but they required installing R separately and then using R code to activate the menus.
These results apply to scholarly articles in general. The results in specific fields or journals are very likely to be different.
To see many other ways to estimate the market share of this type of software, see my ongoing article, The Popularity of Data Science Software. My next post will update the job advertisements that list science software. You may also be interested in my in-depth reviews of point-and-click user interfaces to R. I invite you to subscribe to my blog or follow me on twitter where I announce new posts. Happy computing!
Thanks for this valuable information! I am a data scientist in academia, and see these patterns roughly at my institution. The exception is I haven’t encountered anyone using SPSS. I wonder if the conclusions change if you look at market share through time rather than the 2015, 2018 comp %. If normalizing by total number of hits for all packages, does R continue to rise? This may also be less vulnerable to changes in the search algorithm.
Hi Hudson,
The lack of SPSS usage among your colleagues isn’t too surprising if they’re all data scientists. We see most of our SPSS use among scientists that only occasionally analyze data. That occasional use makes learning a language difficult.
Regarding the plots of counts, if I take the raw counts for each package and divide them by the total hits for all packages, then I’ll have the plot in a form of % of hits. Is that what you mean? If so, the shape of the plot won’t change, since everything is being divided by a constant. Only the labels on the y-axis will change. Or am I misunderstanding you?
Cheers,
Bob
Really interesting! However, you have to take this with a grain of salt. There is a lot of usage outside of academia that isn’t published, and I would argue that often firms do work for several years before they decide to publish it… so scholarly papers may not be the most leading indicator.
Also, pricing models for academic use are often much more favorable, so I think you have to be careful assuming that use in scholarly papers equates to willingness to pay premium for convenience.