Blog

R GUI Comparison Update

Graphical user interfaces for the R language are easy to use and getting more powerful all the time. Here is my updated comparison of jamovi, JASP, BlueSky Statistics (free & Pro), Rattle, RKWard, R-Instat, R AnalyticFlow, and R Commander.

With so many detailed reviews of Graphical User Interfaces (GUIs) for R available, which should you choose? It’s not too difficult to rate them based on the number of features they offer, so I’ll start there. Then, I’ll follow with a brief overview of each.

I’m basing the counts on the number of dialog boxes in each category of the following categories:

  • Ease of Use
  • General Usability
  • Graphics
  • Analytics
  • Reproducibility

This data is trickier to collect than you might think. Some software has fewer menu choices, depending instead on more detailed dialog boxes. Studying every menu and dialog box is very time-consuming, but that is what I’ve tried to do to keep this comparison trustworthy.

Perhaps the biggest flaw in this methodology is that every feature adds only one point to each GUI’s total score. I encourage you to download the full dataset and consider which features are most important to you. If you decide to make your own graphs with a different weighting system, I’d love to hear from you in the comments below. Thomas Langkamp did an excellent comparison focused on teaching statistics. You can read it here.

Ease of Use

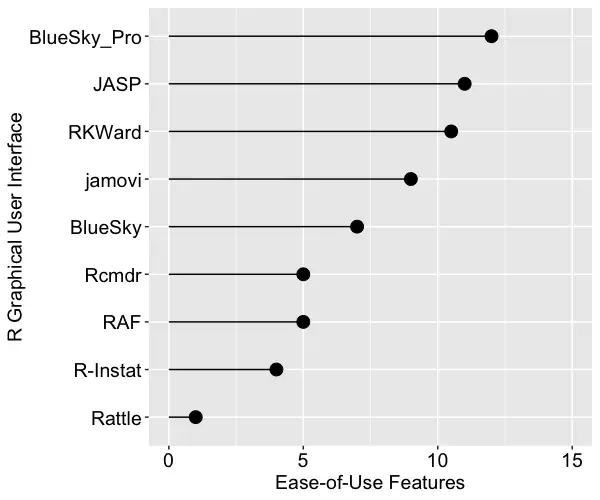
For ease of use, I’ve defined it primarily by how well each GUI meets its primary goal: avoiding code. They get one point for each of the following abilities, which include being able to install, start, and use the GUI to its maximum effect, including publication-quality output, without knowing anything about the R language itself. Figure 1 shows the result. R Commander is abbreviated Rcmdr, and R AnalyticFlow is abbreviated RAF. The commercial BlueSky Pro comes out on top by a slim margin, followed closely by JASP and RKWard. None of the GUIs achieved the highest possible score of 15, so there is room for improvement.

The ease of use features are:

  • Installs without the use of R
  • Starts without the use of R
  • Remembers recent files
  • Hides R code by default
  • Uses its full capability without needing R code
  • Data editor included
  • Pub-quality tables w/out R code steps
  • Simple menus that grow as needed
  • Table of Contents to ease navigation
  • Variable labels ease identification in the output
  • Easy to move blocks of output
  • Ease reading columns by freezing headers of long tables
  • Accepts data pasted from the clipboard
  • Easy to move header row of pasted data into the variable name field
  • Includes AI interface to ease interpretation of output
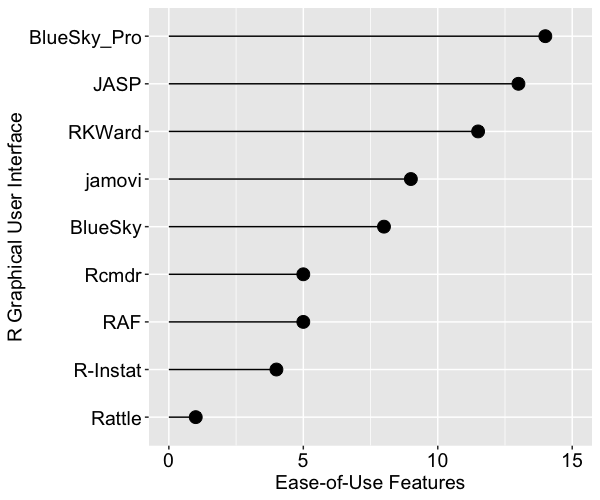
Figure 1. The number of ease-of-use features offered by each R GUI.

General Usability

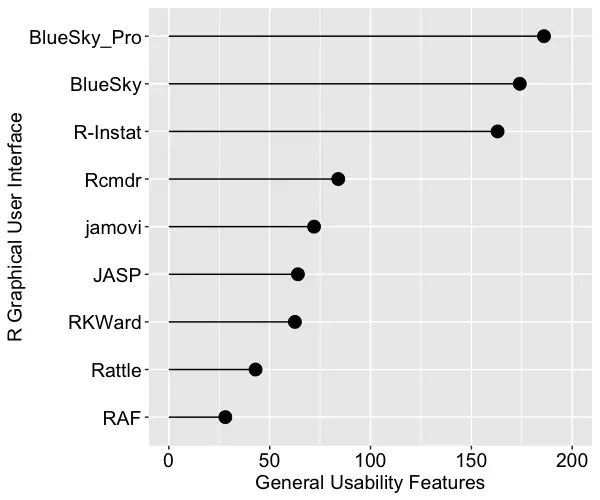
This category is dominated by data-wrangling capabilities, which data scientists and statisticians spend most of their time on. It also includes various types of data input and output. We see in Figure 2 that both BlueSky versions and R-Instat come out on top, not just due to their excellent selection of data-wrangling features but also for their use of the rio package for importing and exporting files. The rio package combines the import/export capabilities of many other packages, and it is easy to use. I expect the other GUIs will eventually adopt it, raising their scores by around 20 points.

The general usability features are:

  • Operating systems (how many)
  • Import data file types (how many)
  • Import from databases (how many)
  • Export data file types (how many)
  • Languages displayable in UI (how many, besides English)
  • Easy to repeat any step by groups (split-file)
  • Multiple data files open at once
  • Multiple output windows
  • Multiple code windows
  • Variable metadata view
  • Variable types (how many)
  • Variable search/filter in dialogs
  • Variable sort by name
  • Variable sort by type
  • Variable move manually
  • Model Builder (how many effect types)
  • Magnify GUI for teaching
  • R code editor
  • Comment/uncomment blocks of code
  • Package management (comes with R and all packages)
  • Output: word processing features
  • Output: R Markdown
  • Output: LaTeX
  • Data wrangling (how many)
  • Transform across many variables at once (e.g., row mean)
  • Transform down many variables at once (e.g., log, sqrt)
  • Assign factor labels across many variables at once
  • Project saves/loads data, dialogs, and notes in one file
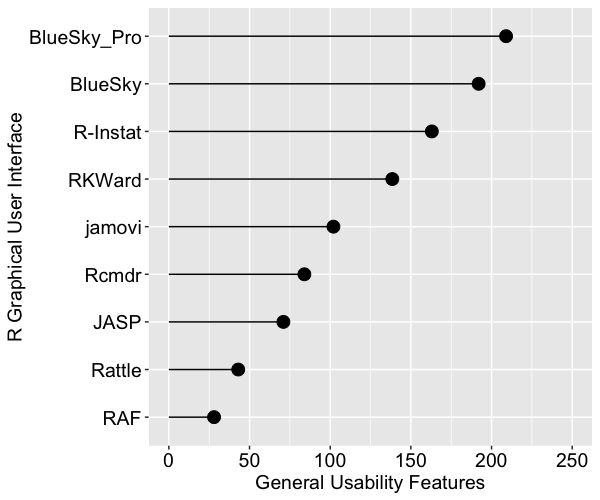
Figure 2. The number of general usability features in each R GUI.

Graphics

This category consists mainly of the number of plot types each software offers. However, the other items can be very important to completing your work. They should add more than one point to the graphics score, but I scored them one point since some will view them as very important while others might not need them at all. Be sure to see the full reviews or download the Excel file if those features are important to you. Figure 3 shows the total graphics score for each GUI. jamovi has a solid lead in this category. R-Instat’s ability to layer any geometric object, or “geom,” on top of another could substantially increase its count, but I don’t include that since it requires knowledge of R code.

When studying all the graphs in this article, it’s important to consider the difference between the relative and absolute performance. For example, relatively speaking, R Commander is not doing well here, but it does offer over 25 types of plots! That might be fine for your needs.

The graphics features are:

  • Types of graphs (how many)
  • Small multiples (i.e., facets)
  • Large multiples (i.e., by group / split-file)
  • Export graphics formats (how many)
  • Interactive Plot Builder
  • Interactive Plot Editor (e.g., add annotations, arrows, etc.)
  • Able to combine any graphs into a single image
Continued

BlueSky Statistics LLC Releases Third Edition of User Guide

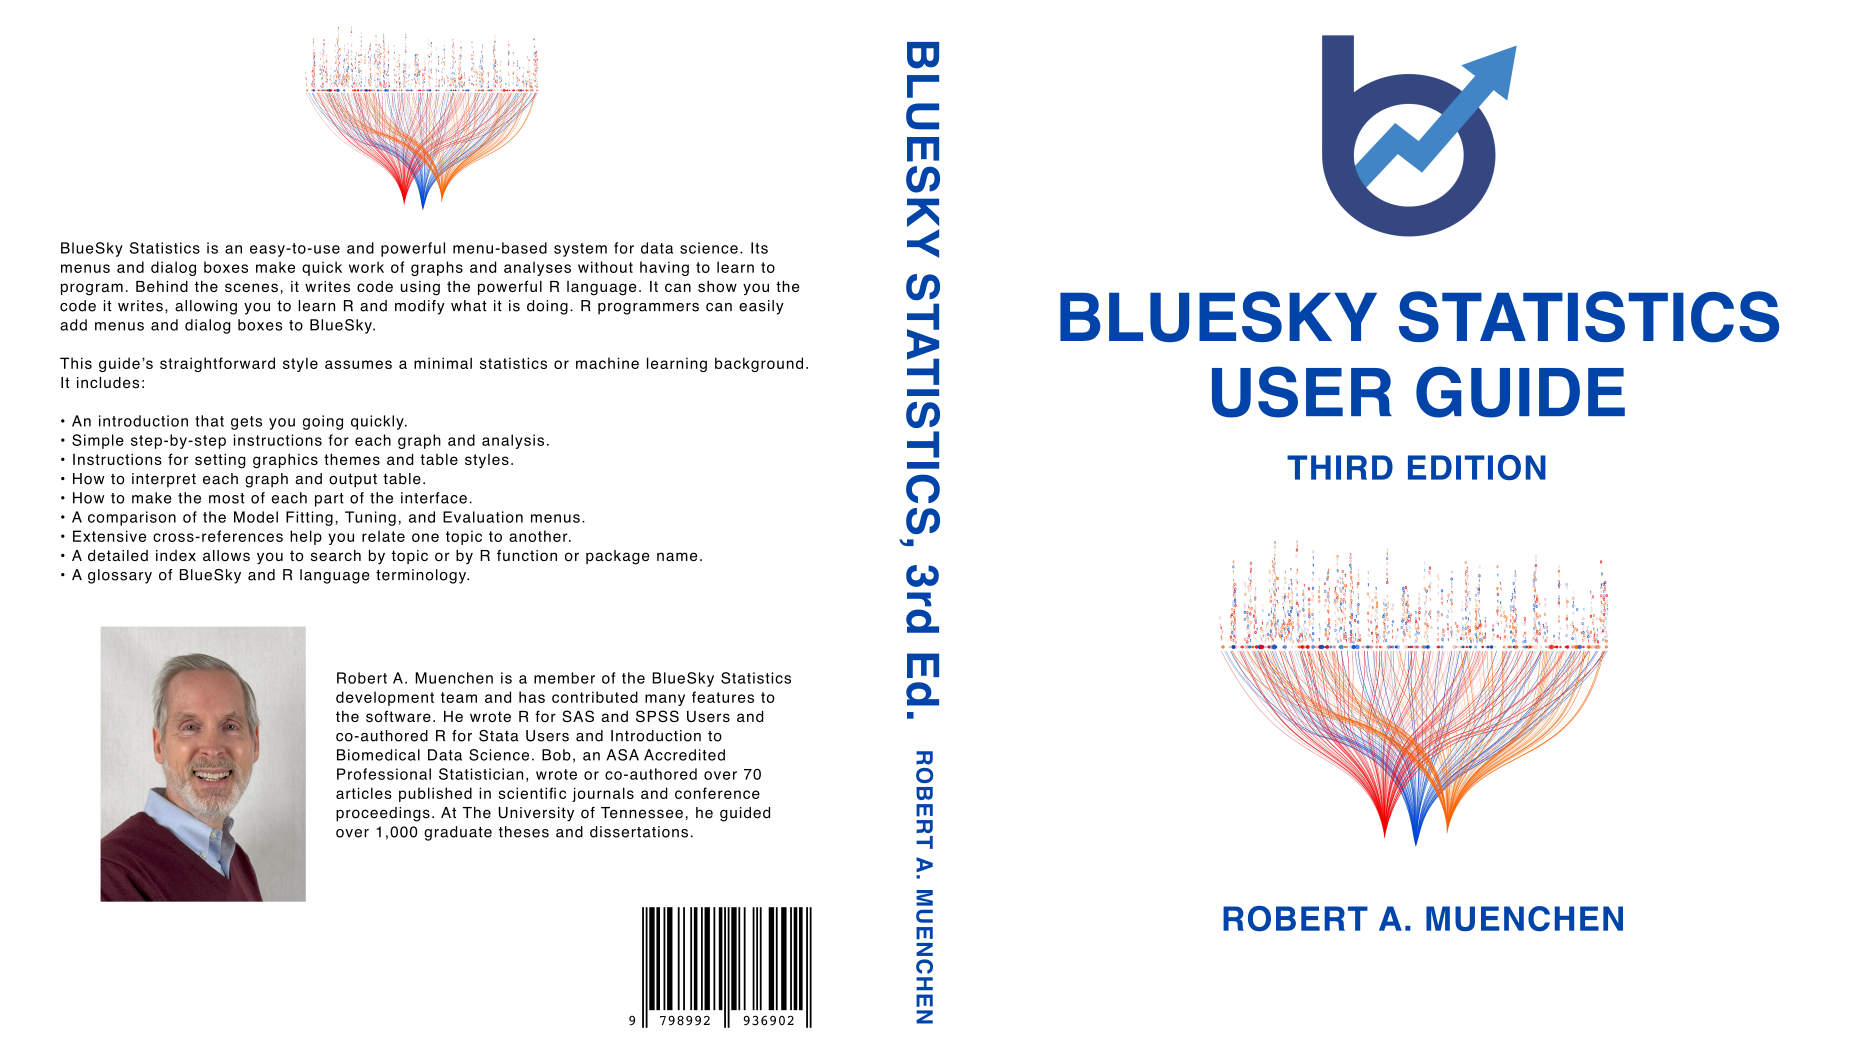
BlueSky Statistics LLC has published the third edition of the User Guide, written by yours truly. It is exclusively available for order here. The previous 6″x 9″ format would have run over 700 pages, so we switched to 8.5″x 11″ to reduce the page count to 533.

While this new edition is available only in print, the previous edition is still on the guide’s webpage. The PDF is not downloadable, as the advertising on that page helps support the considerable effort required to keep up with this rapidly expanding software.

My review of BlueSky Statistics is here, and a summary of how it compares to other R GUIs is here. New topics covered in the third edition include:

  • Using the Table of Contents to skip around the Output window.
  • Freezing table labels as contents scroll beneath them.
  • Adding variable labels to all tabular results.
  • Renaming output tabs.
  • Using the Datagrid’s audit trail.
  • Rerunning an entire workflow with a single click.
  • Automating the replacement of datasets when rerunning a workflow.
  • Using project files to save or load many files simultaneously.
  • Cleaning Excel files to remove rows or columns and create multi-row variable names.
  • Automating the extraction of repeating patterns of variables.
  • Creating cumulative statistics variables.
  • Separating delimited values stored in a character variable.
  • Converting characters to dates using expanded and simplified formats.
  • Reading date/time variables; adding times to dates.
  • Filling missing values upward or downward (e.g., last observation carried forward).
  • Creating scatterplot matrix displays.
  • Creating dual-axis plots.
  • Plotting dose-response curves.
  • Using new main effects and interaction plots.
  • Displaying forest plots.
  • Using new confidence interval plots (better for many factors).
  • Performing subject matching.
  • Performing risk set matching.
  • Comparing groups by competing risks.
  • Testing for mean equivalence.
  • Calculating concordance correlation coefficients for multiple raters.
  • Calculating categorical agreement.
  • Using the new polynomial regression dialog.
  • Fitting nonlinear regression models.
  • Testing confirmatory factor analysis.
  • Performing structural equation modeling.
  • Generating M by two tables for relative risks and odds ratios.
  • Using the response optimizer for linear or response surface models.

Thanks to everyone who sent in suggestions to improve this edition!

See New BlueSky Statistics Features at The Quality Show and ASQ

BlueSky Statistics is easy-to-use software for statistics and machine learning. Behind the scenes it does all its work using the powerful R language. It can show you the code it writes, which you can modify for finer control. It comes in a free Base version and a commercial Pro version. BlueSky Statistics LLC has greatly enhanced its quality control and Six Sigma capabilities, as described here. Many of the enhancements have come at the request of the manufacturers who have recently migrated to BlueSky Statistics from Minitab or JMP. These features will be demonstrated at Quality Show South, NashvilleBooth 418, April 16-17, and ASQ World Conference on Quality & Improvement, Denver, Booth 314, May 4-7.

R GUI Reviews Updated

I have just finished updating my reviews of graphical user interfaces for the R language. These include BlueSky Statistics, jamovi, JASP, R AnalyticFlow, R Commander, R-Instat, Rattle, and RKward. The permanent link to the article that summarizes it all is https://r4stats.com/articles/software-reviews/r-gui-comparison/.
I list the highlights below as this post to reach all the blog aggregators. If you have suggestions for improving any of the reviews, please let me know at muenchen.bob@gmail.com.

With so many detailed reviews of Graphical User Interfaces (GUIs) for R available, which should you choose? It’s not too difficult to rank them based on the number of features they offer, so I’ll start there. Then, I’ll follow with a brief overview of each.

I’m basing the counts on the number of dialog boxes in each category of the following categories:

  • Ease of Use
  • General Usability
  • Graphics
  • Analytics
  • Reproducibility

This data is trickier to collect than you might think. Some software has fewer menu choices, depending on more detailed dialog boxes instead. Studying every menu and dialog box is very time-consuming, but that is what I’ve tried to do to keep this comparison trustworthy. Each development team has had a chance to look the data over and correct errors.

Perhaps the biggest flaw in this methodology is that every feature adds only one point to each GUI’s total score. I encourage you to download the full dataset to consider which features are most important to you. If you decide to make your own graphs with a different weighting system, I’d love to hear from you in the comments below.

Ease of Use

For ease of use, I’ve defined it primarily by how well each GUI meets its primary goal: avoiding code. They get one point for each of the following abilities, which include being able to install, start, and use the GUI to its maximum effect, including publication-quality output, without knowing anything about the R language itself. Figure one shows the result. R Commander is abbreviated Rcmdr, and R AnalyticFlow is abbreviated RAF. The commercial BlueSky Pro comes out on top by a slim margin, followed closely by JASP and RKWard. None of the GUIs achieved the highest possible score of 14, so there is room for improvement.

  • Installs without the use of R
  • Starts without the use of R
  • Remembers recent files
  • Hides R code by default
  • Use its full capability without using R
  • Data editor included
  • Pub-quality tables w/out R code steps
  • Simple menus that grow as needed
  • Table of Contents to ease navigation
  • Variable labels ease identification in the output
  • Easy to move blocks of output
  • Ease reading columns by freezing headers of long tables
  • Accepts data pasted from the clipboard
  • Easy to move header row of pasted data into the variable name field
Figure 1. The number of ease of use features offered by each R GUI.

General Usability

This category is dominated by data-wrangling capabilities, where data scientists and statisticians spend most of their time. It also includes various types of data input and output. We see in Figure 2 that both BlueSky versions and R-Instat come out on top not just due to their excellent selection of data-wrangling features but also for their use of the rio package for importing and exporting files. The rio package combines the import/export capabilities of many other packages, and it is easy to use. I expect the other GUIs will eventually adopt it, raising their scores by around 20 points.

  • Operating systems (how many)
  • Import data file types (how many)
  • Import from databases (how many)
  • Export data file types (how many)
  • Languages displayable in UI (how many, besides English)
  • Easy to repeat any step by groups (split-file)
  • Multiple data files open at once
  • Multiple output windows
  • Multiple code windows
  • Variable metadata view
  • Variable types (how many)
  • Variable search/filter in dialogs
  • Variable sort by name
  • Variable sort by type
  • Variable move manually
  • Model Builder (how many effect types)
  • Magnify GUI for teaching
  • R code editor
  • Comment/uncomment blocks of code
  • Package management (comes with R and all packages)
  • Output: word processing features
  • Output: R Markdown
  • Output: LaTeX
  • Data wrangling (how many)
  • Transform across many variables at once (e.g., row mean)
  • Transform down many variables at once (e.g., log, sqrt)
  • Assign factor labels across many variables at once
  • Project saves/loads data, dialogs, and notes in one file
Figure 2. The number of general usability features in each R GUI.

Graphics

This category consists mainly of the number of graphics each software offers. However, the other items can be very important to completing your work. They should add more than one point to the graphics score, but I scored them one point since some will view them as very important while others might not need them at all. Be sure to see the full reviews or download the Excel file if those features are important to you. Figure 3 shows the total graphics score for each GUI. R-Instat has a solid lead in this category. In fact, this underestimates R-Instat’s ability if you include its options to layer any “geom” on top of another graph. However, that requires knowing the geoms and how to use them. That’s knowledge of R code, of course.

When studying these graphs, it’s important to consider the difference between the relative and absolute performance. For example, relatively speaking, R Commander is not doing well here, but it does offer over 25 types of plots! That absolute figure might be fine for your needs.

Continued…

BlueSky Statistics Version 10 is Not Open Source

BlueSky Statistics is a graphical user interface for the powerful R language. On July 10, 2024, the BlueskyStatistics.com website said:

“…As the BlueSky Statistics version 10 product evolves, we will continue to work on orchestrating the necessary logistics to make the BlueSky Statistics version 10.x application available as an open-source project. This will be done in phases, as we did for the BlueSky Statistics 7.x version. We are currently rearchitecting its key components to allow the broader community to make effective contributions. When this work is complete, we will open-source the components for broader community participation…”

In the current statement (September 5, 2024), the sentence regarding version 10.x becoming open source is gone. This line was added:

“…Revenue from the commercial (Pro) version plays a vital role in funding the R&D needed to continue to develop and support the open-source (BlueSky Statistics 7.x) version and the free version (BlueSky Statistics 10.x Base Edition)…”

I have verified with the founders that they no longer plan to release version 10 with an open-source license. I’m disappointed by this change as I have advocated for and written about open source for many years.

There are many advantages of open-source licensing over proprietary. If the company decides to stop making version 10 free, current users will still have the right to run the currently installed version, but they will only be able to get the next version if they pay. If it were open source, its users could move the code to another repository and base new versions on that. That scenario has certainly happened before, most notably with OpenOffice. BlueSky LLC has announced no plans to charge for future versions of BlueSky Base Edition, but they could.

I have already updated the references on my website to reflect that BlueSky v10 is not open source. I wish I had been notified of this change before telling many people at the JSM 2024 conference that I was demonstrating open-source software. I apologize to them.

BlueSky Statistics Enhancements

BlueSky Statistics Base is a free graphical user interface for the powerful R language. There is also a commercial “Pro” version that offers tech support, priority feature requests, and many powerful additional features. The Pro version has been beefed up considerably with the new features below. These features apply to quality control, general statistics, team collaboration, project management, and scripting. Many are focused on quality control and Six Sigma as a result of requests from organizations migrating from Minitab and JMP. However, both versions of BlueSky Statistics offer a wide range of statistical, graphical, and machine-learning methods.

The free version saves every step of the analysis for full reproducibility. However, repeating the analysis is a step-by-step process. The Pro version can now rerun the entire set at once, substituting other datasets when needed.

You can obtain either version at https://BlueSkyStatistics.com. A detailed review is available at https://r4stats.com/articles/software-reviews/bluesky/. If you plan to attend the Joint Statistical Meetings (JSM) in Portland next week, stop by Booth 406 to get a demonstration. We hope to see you there!

Copy and Paste data from Excel

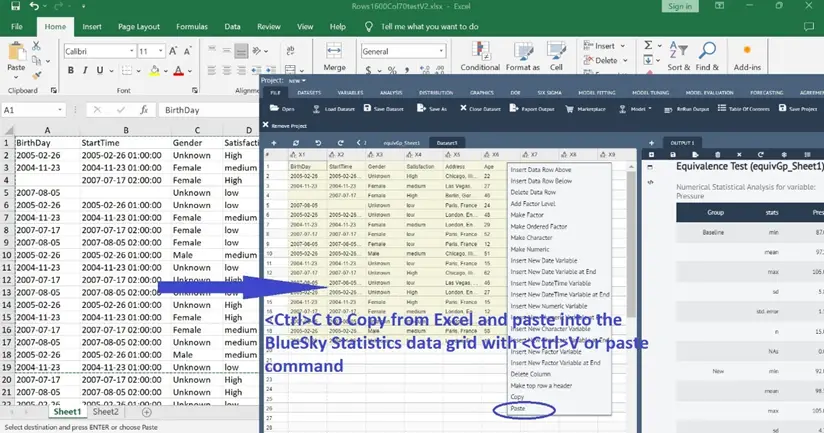
Copy data from Excel and paste it into the BlueSky Statistics data grid. This is in addition to the existing mechanism of bringing data through file import for various file formats into BlueSky Statistics to perform data analysis.

Undo/Redo data grid edits

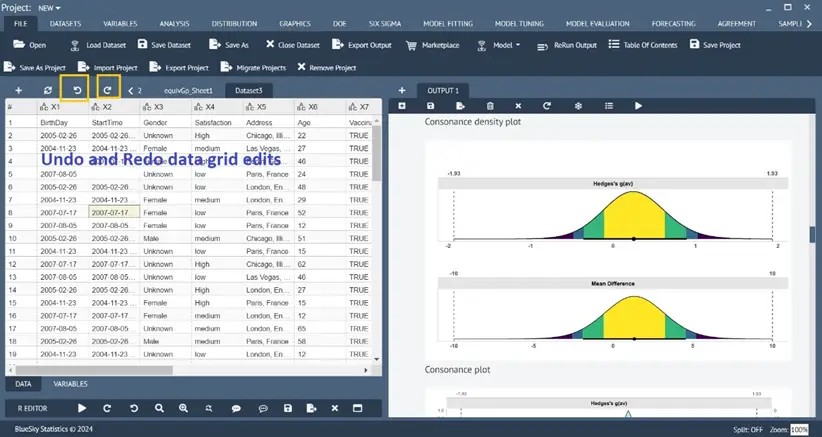
Single-item and muti-items data element edits can be discarded by undo and restored by redo operations.

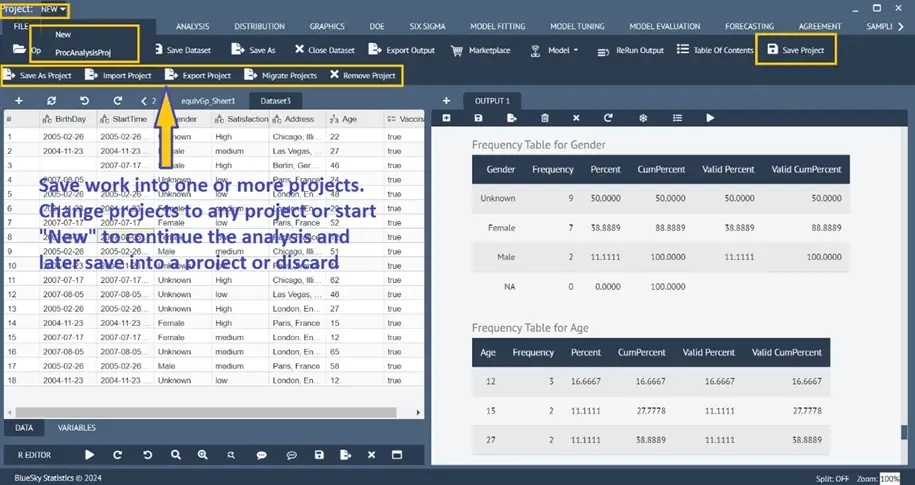
Project save/open to save/open all work (all open datasets and output analysis)

Analysis performed can be saved into one or more projects. Each project contains all the datasets along with all the analyses and any R code from the editor. The projects can be exported and shared (sent as .bsp, which is a zip file; “bsp” is an abbreviation of BlueSky Statistics Project) with other BlueSky Statistics users. The users can import projects, see all the datasets and analyses stored in the projects, and subsequently add/modify/rerun all the analyses.

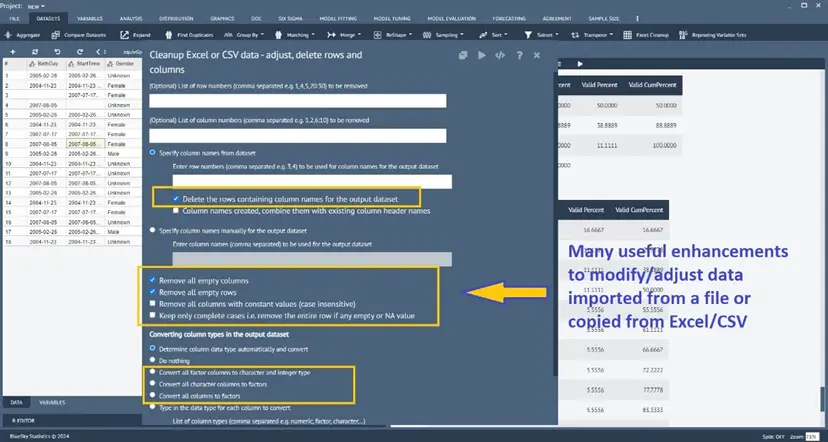
Enhanced cleaning/adjustment of copied/imported Excel/CSV data on the Datagrid

Dataset > Excel Cleanup

There are a few enhancements made to offer additional data cleanup/adjustment options to the existing Excel Cleanup dialog to clean/adjust (i.e., rows. Columns, data type, etc.) data on the BlueSky Statistics data grid, irrespective of how the data was loaded into the data grid with the file open option or by copying and pasting from Excel/CSV file.

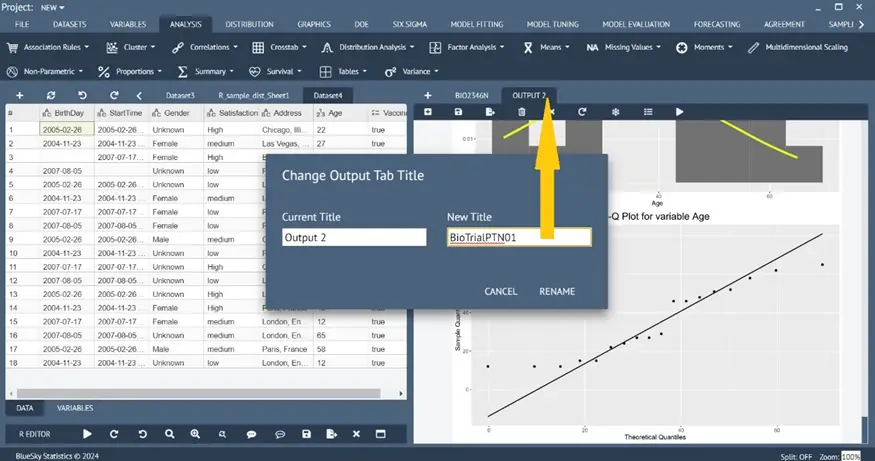
Renaming output tabs

Double-clicking on the output tab will open a dialog box asking for the new name. The user can type in a name to rename the output tab.

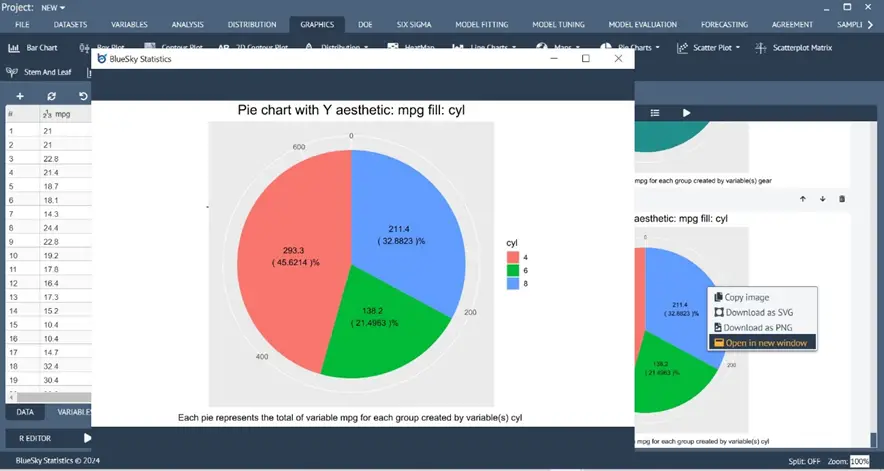
Enhanced Pie Chart and Bar Chart

Graphics > Pie Charts > Pie Chart
Graphics > Bar Chart

              The pie chart and bar chart have been enhanced to show % and counts on the plot.

Scatterplot Matrix

Graphics > Scatterplot Matrix

The Scatter Plot Matrix dialog has been added.

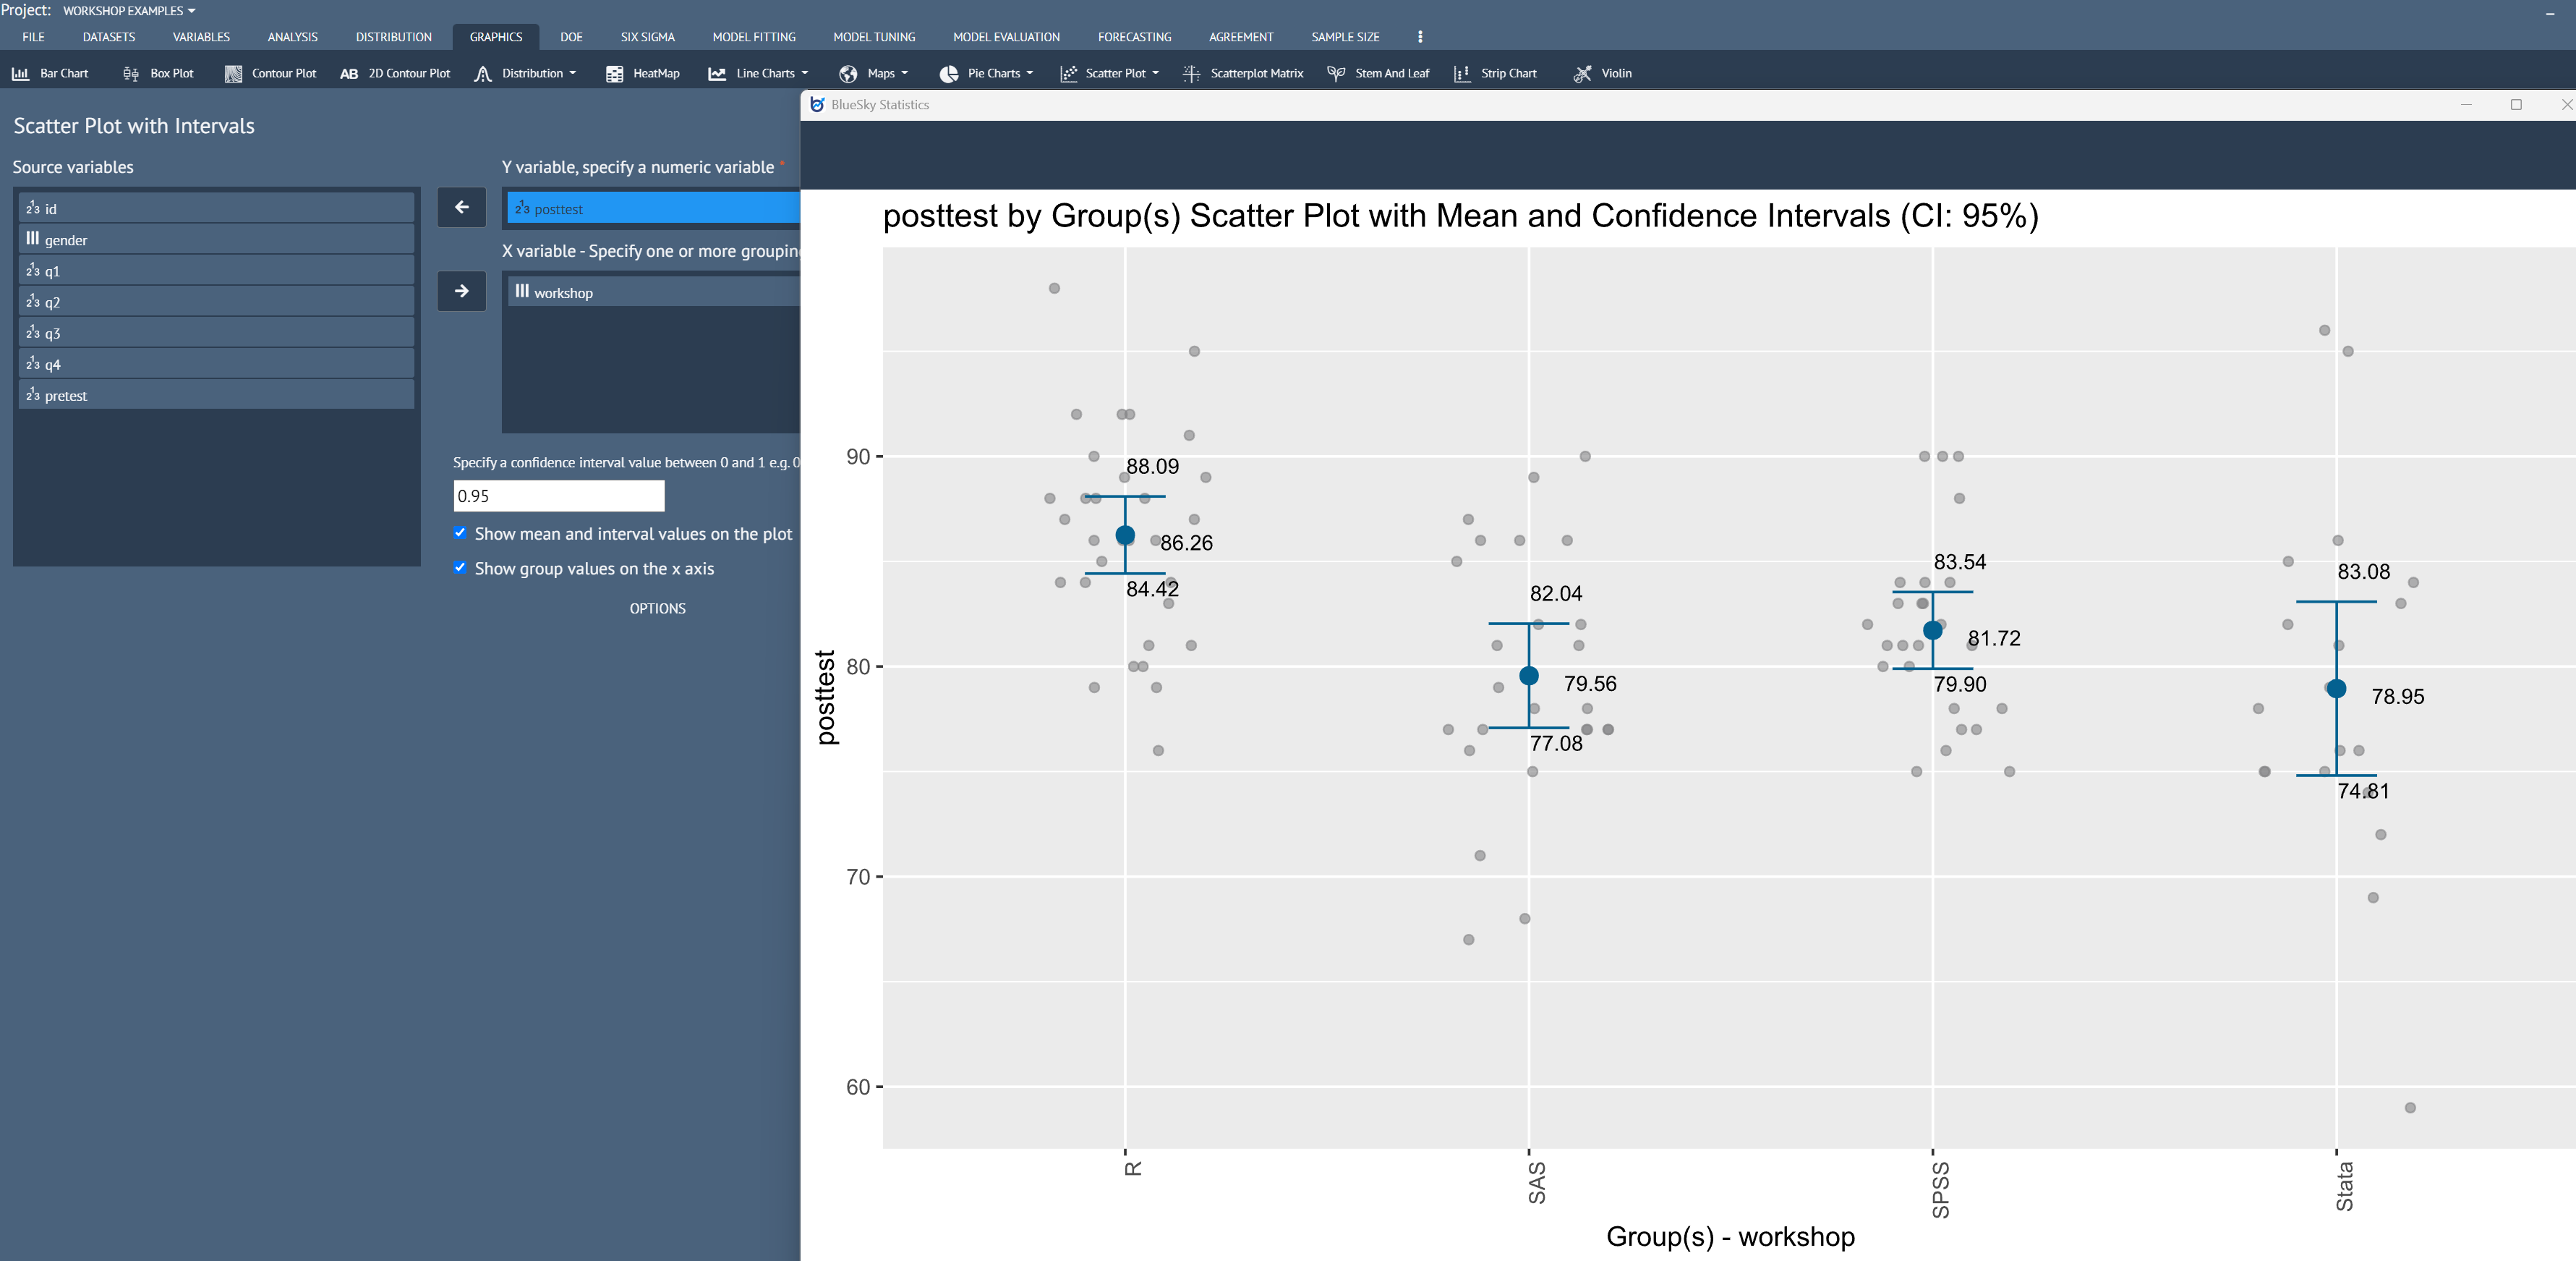
Scatterplot with mean and confidence interval bar

Graphics > Scatterplot > Scatter Plot with Intervals

A Scatter Plot dialog with mean and confidence interval bar has been made available with an unlimited number of grouping variables for the X-axis to group a numeric variable for the Y-axis.

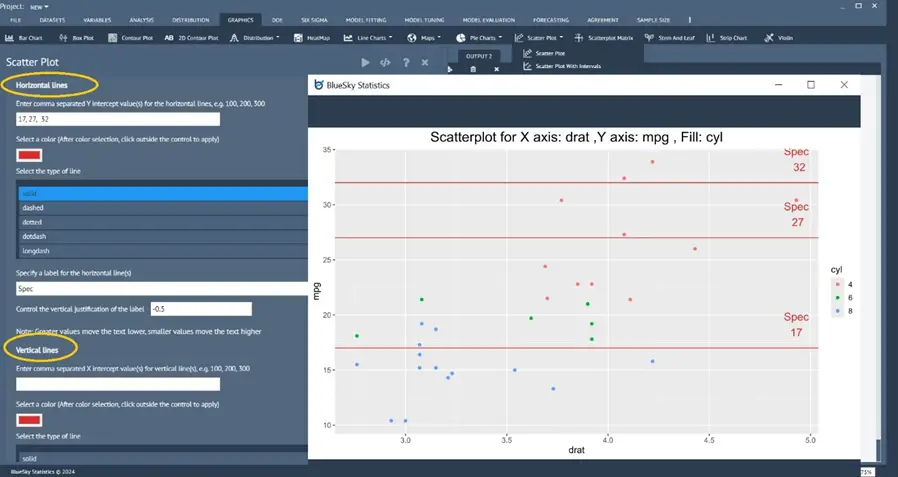
Enhanced Scatterplot with both horizontal and vertical reference lines

Graphics > Scatterplot > Scatter Plot Ref Lines

The Scatterplot dialog has been enhanced so that users can add an unlimited number of reference lines (horizontal and vertical axis) to the plot. 

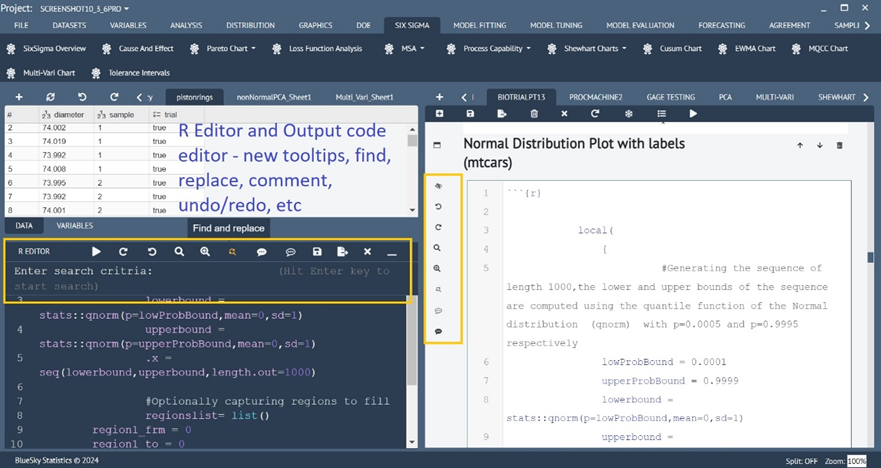
Enhancements to BlueSky Statistics R Editor and Output Syntax/Code Editor

For R-programmers many enhancements have been made to the BlueSky R Editor and the output syntax/code editor to improve ease of use and productivity with tooltips, find and replace, undo/redo, comment/uncomment blocks, etc.

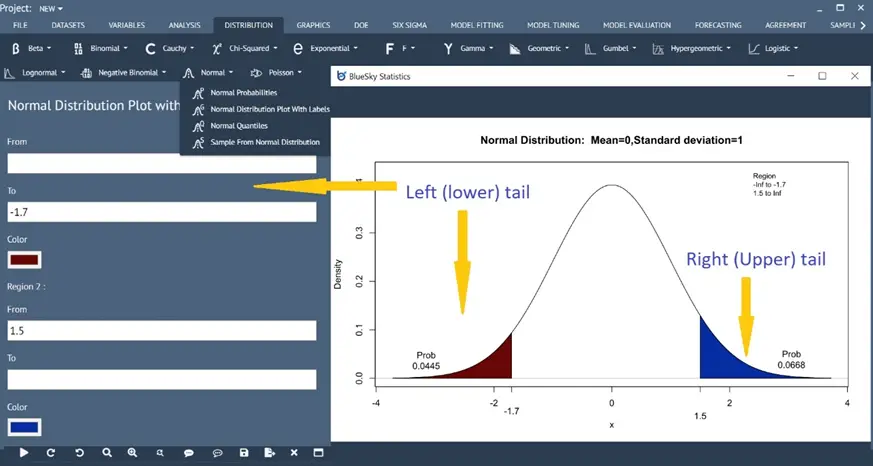
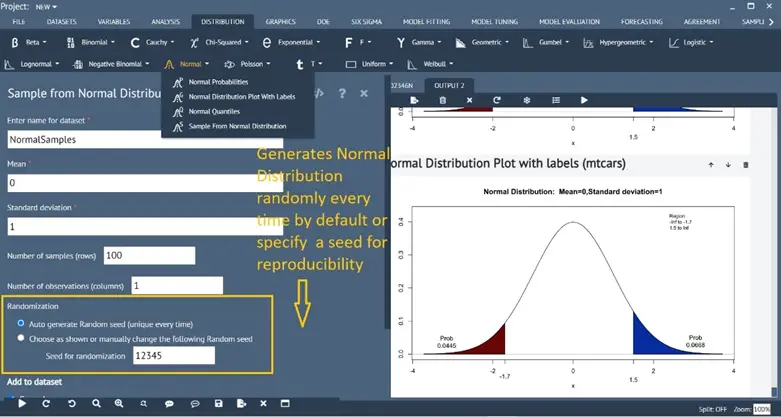
Enhanced Normal Distribution Plot

Distribution > Normal > Normal Distribution Plot with Labels 

  • The normal distribution plot will show the computed probability and x values on the plot for the shaded area for x value and quantiles, respectively
  • Plot one tail (left and right), two tails, and other ranges

Automatic randomization of generating normal sample distribution

Distribution > Normal > Sample from Normal Distribution

In addition to setting a seed value for reproducibility, the default option has been set to randomize automatically the sample data generation every time.

Automatic randomization of design creations of all DoE designs

DOE > Create Design > …. 

In addition to setting a seed value for reproducibility, the default option has been set to randomize the creation of any DoE design every time automatically.

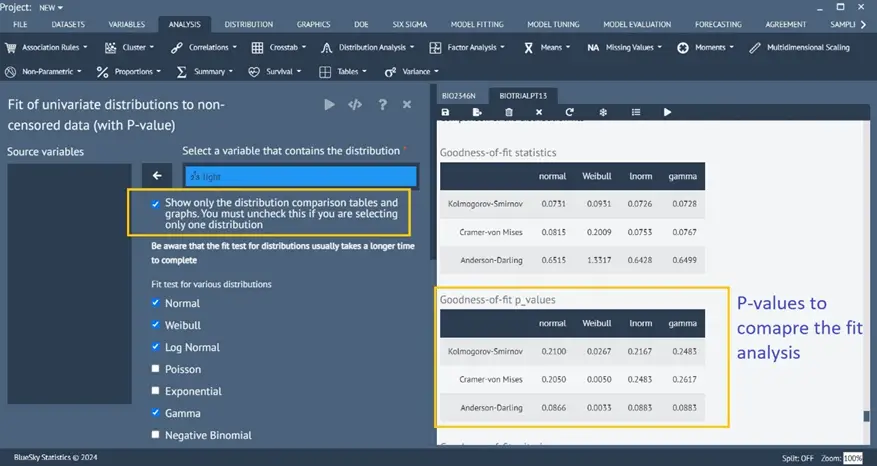
Enhanced Distribution Fit analysis

Analysis > Distribution Analysis > Distribution Fit P-value

The distribution fit analysis has been enhanced to compute AD, KS, and CVM tests and show test statistics, as well as corresponding p-values. These assist users in determining the best fit in addition to the existing AIC and BIC values.

Moreover, an option has been introduced for users to see only the comparison of distributions and skip displaying the analysis of the individual distribution fit analysis.

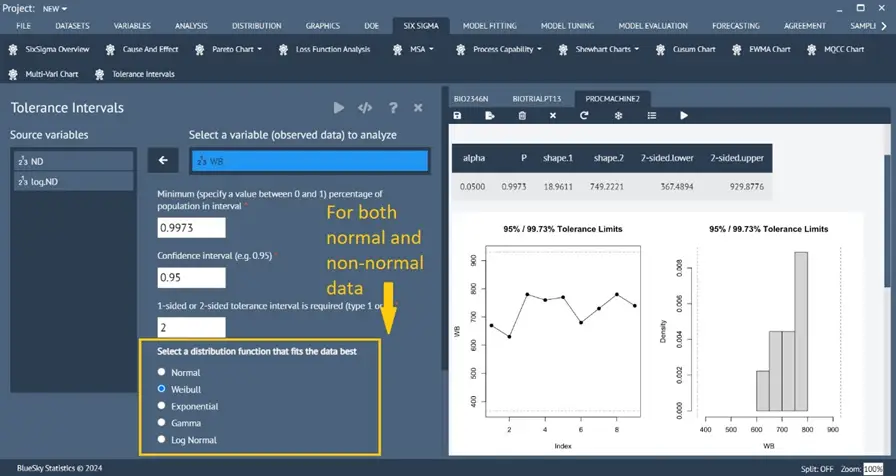
Tolerance Intervals

Six Sigma > Tolerance Intervals

A new Tolerance Intervals analysis has been introduced. The tolerance interval describes the range of values for a distribution with confidence limits calculated to a particular percentile of the distribution. These tolerance limits, taken from the estimated interval, are limits within which a stated proportion of the population is expected to occur.

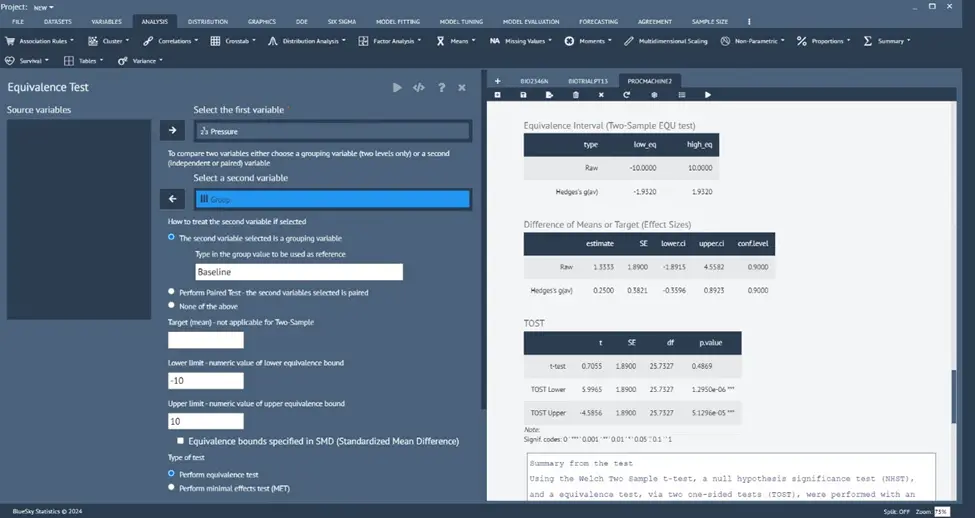
Equivalence (and Minimal Effect) test

Analysis > Means > Equivalence test

This new feature tests for mean equivalence and minimal effects.

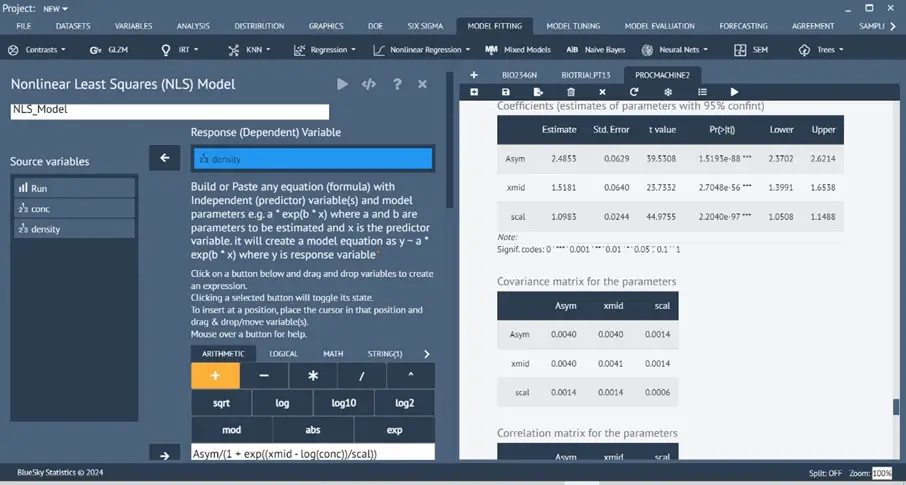
Nonlinear Least Square – all-purpose Non-Linear Regression modeling

Model Fitting > Nonlinear Least Square

Performs non-linear regression with flexibility and many user options to model, test, and plot.

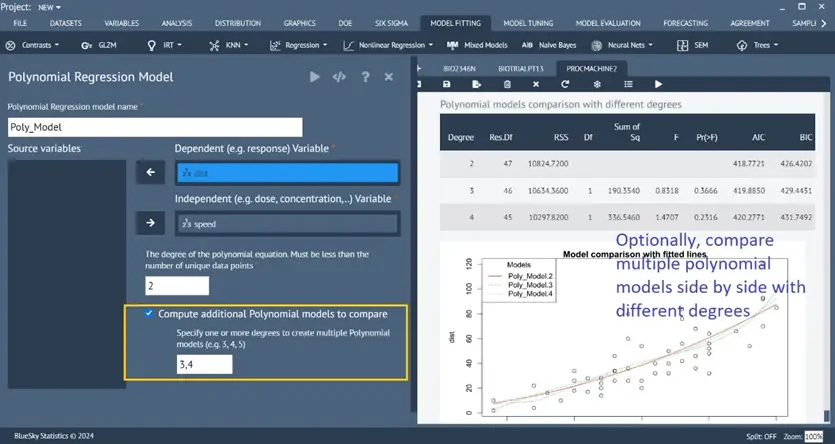
Polynomial Models with different degrees

Model Fitting > Polynomial

Computes and fits an orthogonal polynomial model with a specified degree. Also, optionally compares multiple Polynomial models of different degrees side by side. 

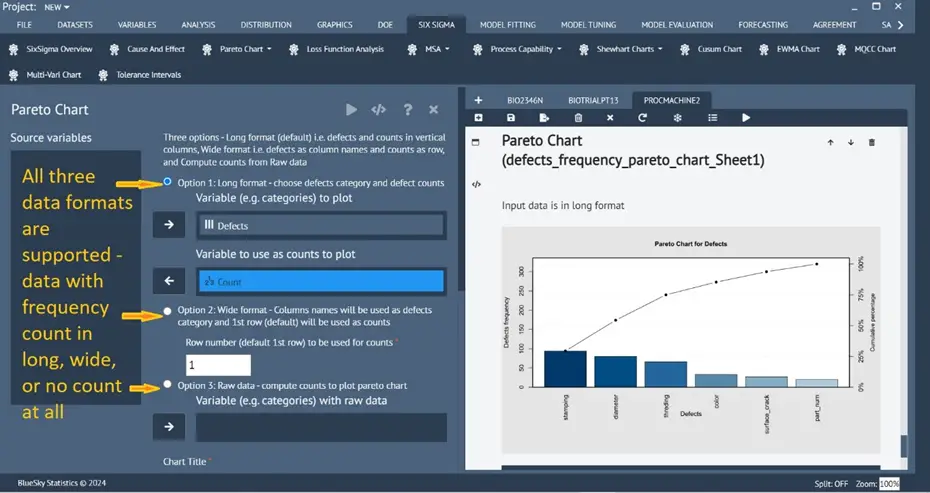
Enhanced Pareto Chart

Six Sigma > Pareto Chart > Pareto Chart

A new option has been added for data that does not have a count column but only has the raw data. Automatically computes cumulative frequency from Raw Data for plotting.

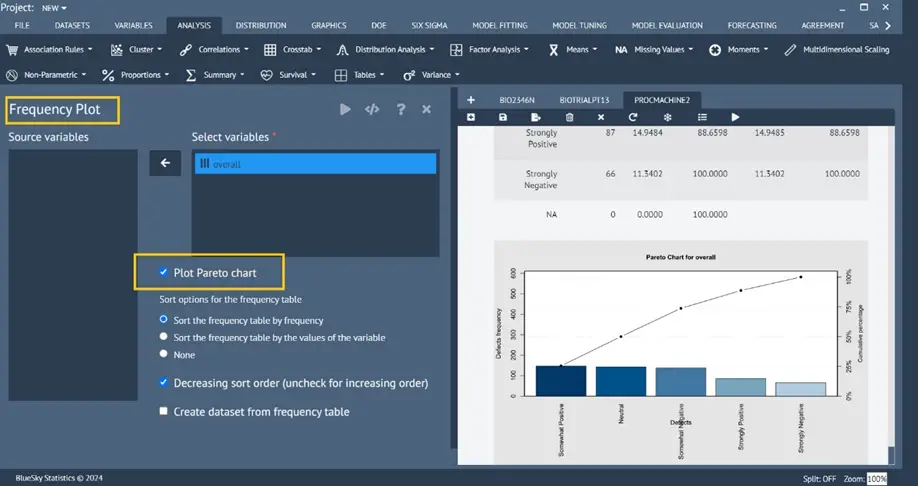
Frequency analysis with an option to draw a Pareto chart

Analysis > Summary > Frequency Plot

A new dialog has been introduced to plot (optionally) the Pareto Chart from the frequency table and, if desired, display the frequency table on the Datagrid.

MSA (Measurement System Analysis) Enhancements

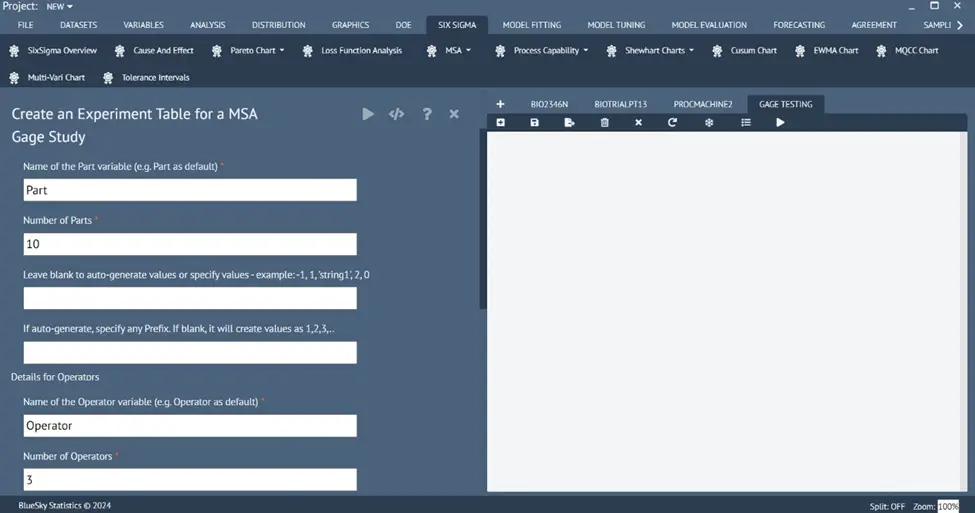
Gage Study Design Table

Six Sigma > MSA > Design MSA Study

Users can generate a randomized design experiment table for any combination of the number of operators, parts, and replications to set up a Gage study table to perform experiments and collect the results to analyze the accuracy of the Gage under study with analysis like Gage R&R, Gage Bias, etc.

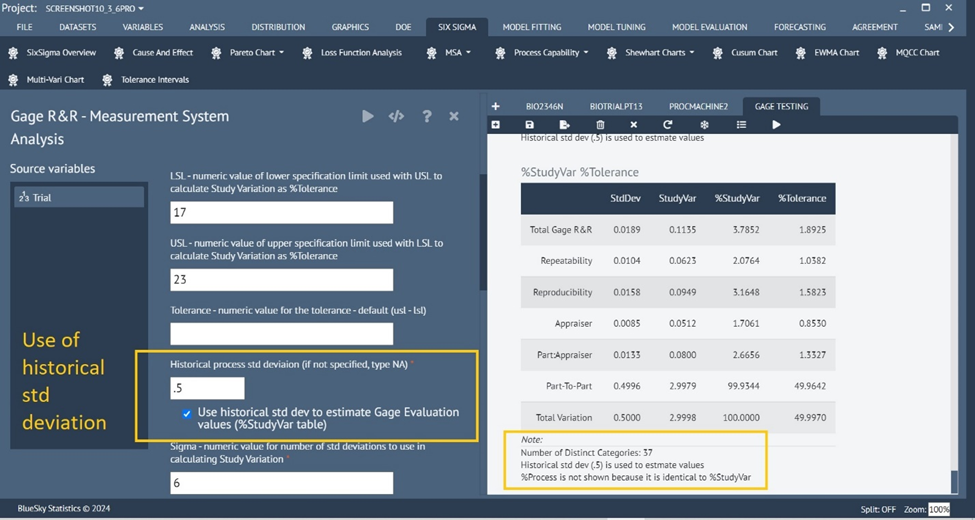
Enhanced Gage R&R

Six Sigma > MSA > Gage R&R

Many enhancements and options have been introduced to the Gage of R&R dialog and the underlying analysis

  • Report header table
  • Enlarged graphs
  • Nested gage data analysis, in addition to crossed
  • Usage of historical process std dev to estimate Gage Evaluation values (%StudyVar table)
  • Show %Process

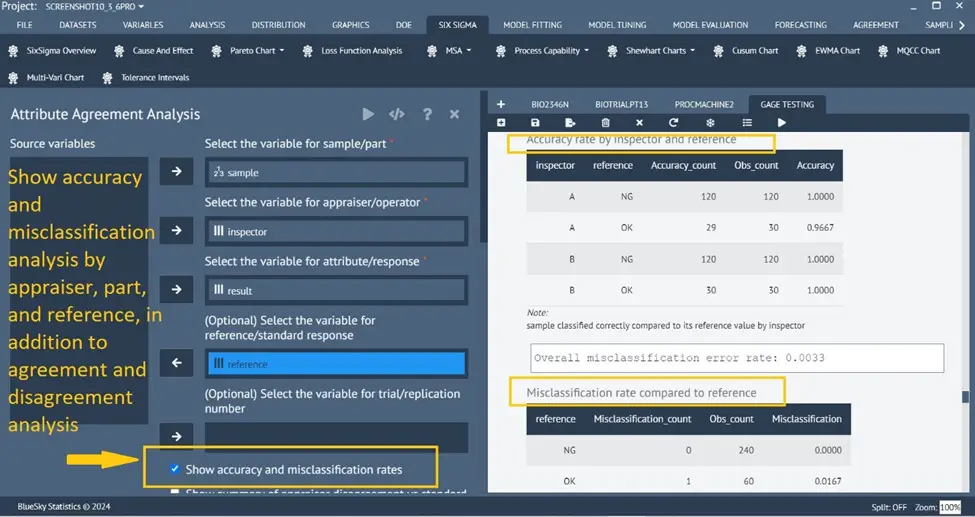
Enhanced Gage Attribute Analysis

Six Sigma > MSA > Attribute Analysis

Many enhancements and options have been introduced to the Attribute Analysis dialog and the underlying analysis

  • Report header table
  • Accuracy and classification rate calculations, in addition to agreement and disagreement
  • Optional Cohen’s Kappa stats (between each pair of raters) in addition to Fleiss Kappa (multi-raters)

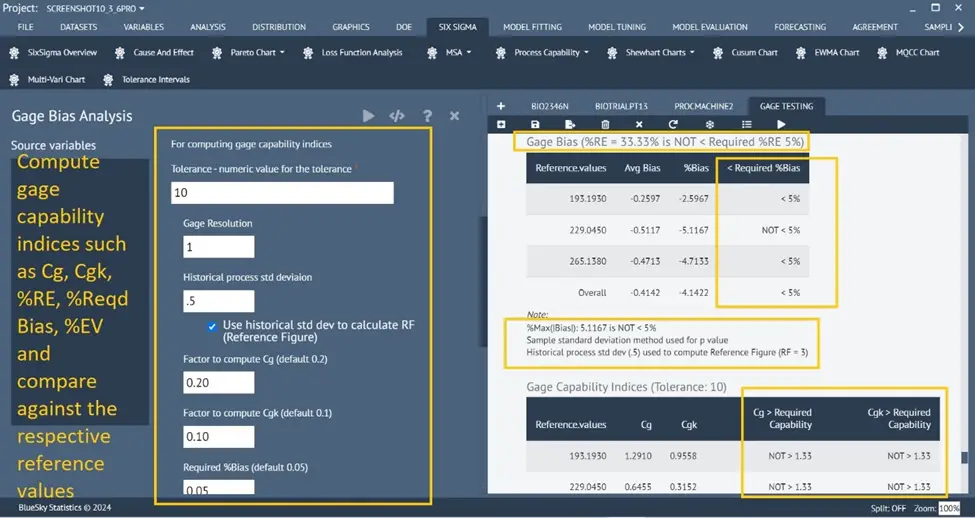
Enhanced Gage Bias Analysis

Six Sigma > MSA > Gage Bias Analysis

Many enhancements and options have been introduced to the Gage Bias Analysis dialog and the underlying analysis

  • Efficient single dialog with options for linearity and type-1 tests for one or more References
  • A new option – “Method to use for estimating repeatability std dev”
  • Cg and Cgk – calculated for different Reference values in one go
  • Run charts for every reference value and an overall run chart for all reference values
  • Usage of historical std dev to calculate RF (Reference Figure)
  • %RE, %EV are introduced, and all tables show how the computed values compared to the required/cut-off values specified by users on the dialog

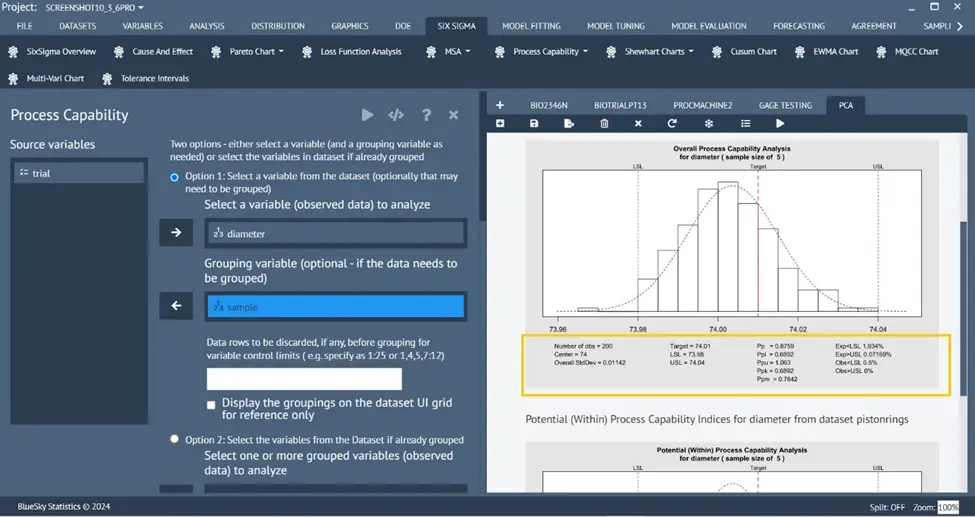
PCA (Process Capability Analysis) Enhancements

Enhanced Process Capability Analysis (for normal data)

Six Sigma > Process Capability > Process Capability

  •  pp_l = pp_k and ppU = ppk is shown when a one-sided tolerance is used
  • Removed underscores to only show Ppl, Ppk, Ppu, Cp, Cpk, .. etc
  • A new option – “Do not use unbiasing constant to estimate std dev for overall process capability indices” to compute overall Ppk (Ppl)
  • Underlying charts (xbar.one) renamed to MR or I Chart based on SD or MR
  • Handling of missing values
  • Customizable number of decimals to show on the plot
  • Standard Deviation label on the plot marked as “Overall StdDev” and “Within StdDev”

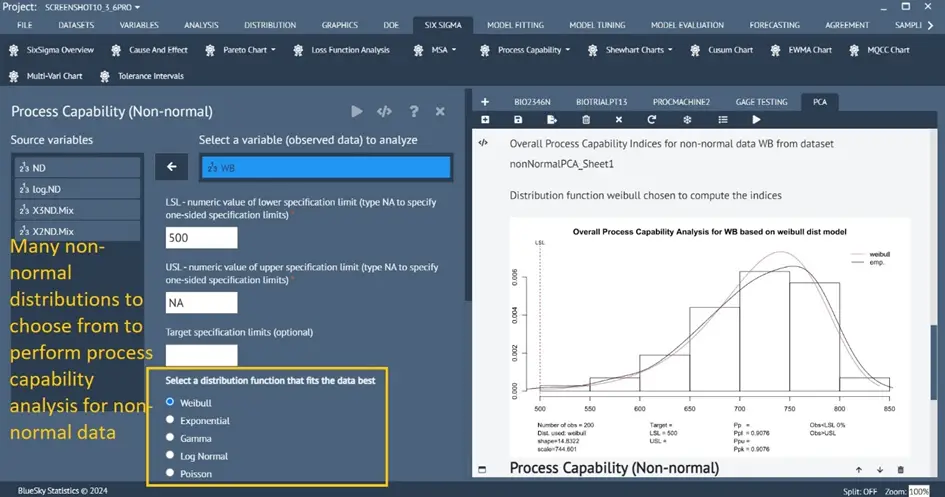
Process Capability Analysis for non-normal data

Six Sigma > Process Capability > Process Capability (Non-Normal)

A new dialog has been introduced to perform process capability analysis for non-normal data.

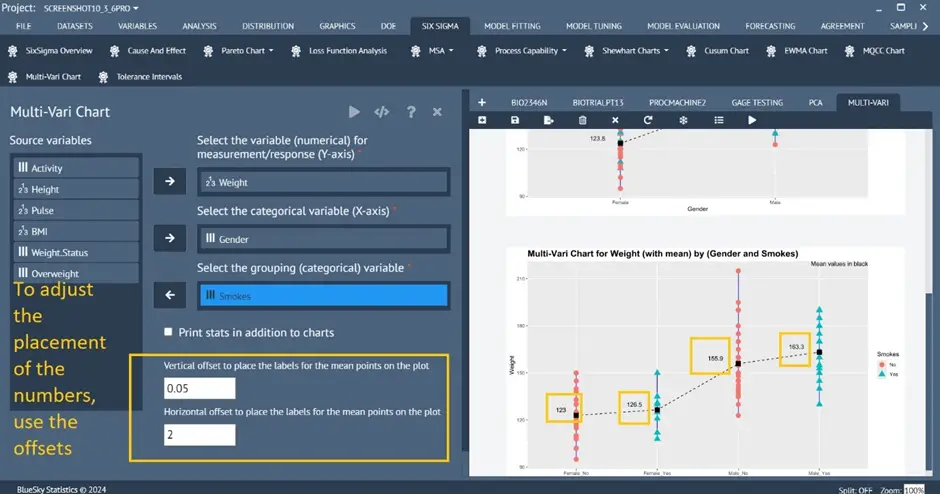
Multi-Vari graph

Six Sigma > Multi-Vari Chart

A new option has been added to adjust horizontal and vertical position offset to place/move the values for the data points on the plot.

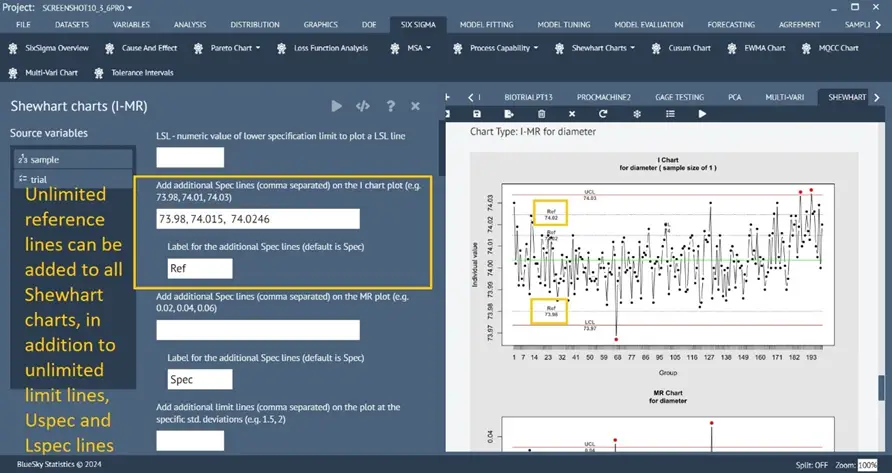
Enhanced Shewhart Charts

Six Sigma > Shewhart Charts > …….

A new option has been added to all Shewhart Charts dialogs: the ability to add any number of spec/reference lines to the chart specified by the user.

Minitab Alternative BlueSky Statistics to Display Graphical Interface to R at ASQ Conference

BlueSky Statistics exhibit at the American Society for Quality World Conference on Quality and Improvement in San Diego from 12 to 14 May, Booth #720 (https://asq.org/conferences/wcqi/solution-partners).

BlueSky Statistics is an R-based software for statistics, data science, Six Sigma, DoE, and more. An alternative to Minitab and similar software, it is designed for quality professionals to identify areas for process and quality improvement and eliminate waste to drive continuous improvement with process capability analysis (PCA), control charts, measurement system analysis (MSA), design of experiments (DoE), distribution analysis, and many more statistical methods.

Ensure R Language Reproducibility with dateback Package

Sooner or later, most R programmers end up with code that no longer runs because of package updates. One way to address the problem was the MRAN Time Machine which Microsoft retired on July 1, 2023. You can get similar functionality for source packages using “dateback,” thanks to Ryota Suzuki. As with MRAN, examples of when you could benefit from using dateback include:

  • Checking the reproducibility of old code without pre-archived R packages.
  • Returning your code to an older state when everything was fine.
  • Needing to work on an older version of R, on which recent versions of some packages do not work properly (or cannot be installed) due to compatibility issues.
  • Needing source package files to make a Docker image stable and reproducible, especially when using an older version of R.

Let’s consider an example. There are three options to install a source package, “ranger.”

Using CRAN:

install.packages("ranger", 
  repos = "https://cloud.r-project.org", type = "source")

Using MRAN Time Machine:

install.packages("ranger", 
  repos = "https://cran.microsoft.com/snapshot/2023-03-01/", 
  type = "source")

Using dateback (with CRAN):

dateback::install("ranger", date = "2023-03-01", 
  repos = "https://cloud.r-project.org")

They ALL get “ranger” and its dependencies (Rcpp and RcppEigen). The differences are:

  • CRAN provides the latest versions, some of which were released AFTER 2023-03-01 (ranger 0.15.1 released on 2023-04-03, and Rcpp 1.0.11 released on 2023-07-06).
  • With MRAN Time Machine, we could get the desired versions (ranger 0.14.1 released on 2022-06-18, and Rcpp 1.0.10 released on 2023-01-22). We could also get the binary versions, but the site is now shut down.
  • dateback gets basically the same versions as MRAN Time Machine, including dependencies (some may slightly differ since we don’t have the exact snapshot of CRAN, but they should be almost identical).

Of course, we can manually search on CRAN and find desired versions. But it makes a huge difference when we install a package with many complicated dependencies (like a package X depends on Y and Z, Y depends on P and Q, and so on). The number of packages needed can run into the dozens. With dateback, you don’t need to worry about what they are or how many.
Ryota is also the lead developer for R AnalyticFlow, the only workflow-style graphical user interface for R. You can download that for free here and read my review of it here. How it compares to other R GUIs is summarized here. Thanks to Ryota for most of the information in this post!

See BlueSky Statistics GUI for R at JSM 2023

Are attending this year’s Joint Statistical Meetings in Toronto? If so, stop by booth 404 to see the latest features of BlueSky Statistics. A menu-based graphical user interface for the R language, BlueSky lets people access the power of R without having to learn to program. Programmers can easily add code to BlueSky’s menus, sharing their expertise with non-programmers. My detailed review of BlueSky is here, a brief comparison to other R GUIs is here, and the BlueSky User Guide is here. I hope to see you in Toronto! [Epilog: at the meeting, I did not know the company had decided to keep the latest version closed-source. Sorry to those I inadvertently misled at the conference.]

Update to Data Science Software Popularity

I’ve updated The Popularity of Data Science Software‘s market share estimates based on scholarly articles. I posted it below, so you don’t have to sift through the main article to read the new section.

Scholarly Articles

Scholarly articles provide a rich source of information about data science tools. Because publishing requires significant effort, analyzing the type of data science tools used in scholarly articles provides a better picture of their popularity than a simple survey of tool usage. The more popular a software package is, the more likely it will appear in scholarly publications as an analysis tool or even as an object of study.

Since scholarly articles tend to use cutting-edge methods, the software used in them can be a leading indicator of where the overall market of data science software is headed. Google Scholar offers a way to measure such activity. However, no search of this magnitude is perfect; each will include some irrelevant articles and reject some relevant ones. The details of the search terms I used are complex enough to move to a companion article, How to Search For Data Science Articles.  

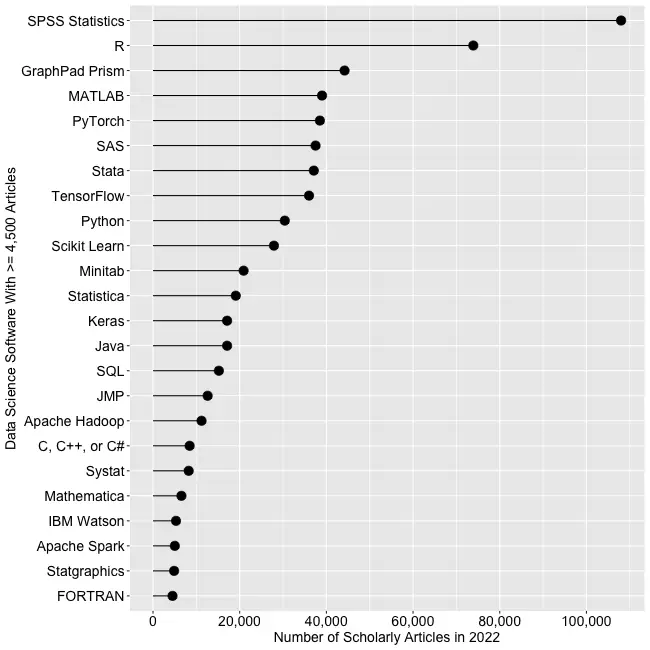
Figure 2a shows the number of articles found for the more popular software packages and languages (those with at least 4,500 articles) in the most recent complete year, 2022.

Figure 2a. The number of scholarly articles found on Google Scholar for data science software. Only those with more than 4,500 citations are shown.

SPSS is the most popular package, as it has been for over 20 years. This may be due to its balance between power and its graphical user interface’s (GUI) ease of use. R is in second place with around two-thirds as many articles. It offers extreme power, but as with all languages, it requires memorizing and typing code. GraphPad Prism, another GUI-driven package, is in third place. The packages from MATLAB through TensorFlow are roughly at the same level. Next comes Python and Scikit Learn. The latter is a library for Python, so there is likely much overlap between those two. Note that the general-purpose languages: C, C++, C#, FORTRAN, Java, MATLAB, and Python are included only when found in combination with data science terms, so view those counts as more of an approximation than the rest. Old stalwart FORTRAN appears last in this plot. While its count seems close to zero, that’s due to the wide range of this scale, and its count is just over the 4,500-article cutoff for this plot.

Continuing on this scale would make the remaining packages appear too close to the y-axis to read, so Figure 2b shows the remaining software on a much smaller scale, with the y-axis going to only 4,500 rather than the 110,000 used in Figure 2a. I chose that cutoff value because it allows us to see two related sets of tools on the same plot: workflow tools and GUIs for the R language that make it work much like SPSS.

Figure 2b. Number of scholarly articles using each data science software found using Google Scholar. Only those with fewer than 4,500 citations are shown.

JASP and jamovi are both front-ends to the R language and are way out front in this category. The next R GUI is R Commander, with half as many citations. Still, that’s far more than the rest of the R GUIs: BlueSky Statistics, Rattle, RKWard, R-Instat, and R AnalyticFlow. While many of these have low counts, we’ll soon see that the use of nearly all is rapidly growing.

Workflow tools are controlled by drawing 2-dimensional flowcharts that direct the flow of data and models through the analysis process. That approach is slightly more complex to learn than SPSS’ simple menus and dialog boxes, but it gets closer to the complete flexibility of code. In order of citation count, these include RapidMiner, KNIME, Orange Data Mining, IBM SPSS Modeler, SAS Enterprise Miner, Alteryx, and R AnalyticFlow. From RapidMiner to KNIME, to SPSS Modeler, the citation rate approximately cuts in half each time. Orange Data Mining comes next, at around 30% less. KNIME, Orange, and R Analytic Flow are all free and open-source.

While Figures 2a and 2b help study market share now, they don’t show how things are changing. It would be ideal to have long-term growth trend graphs for each software, but collecting that much data is too time-consuming. Instead, I’ve collected data only for the years 2019 and 2022. This provides the data needed to study growth over that period.

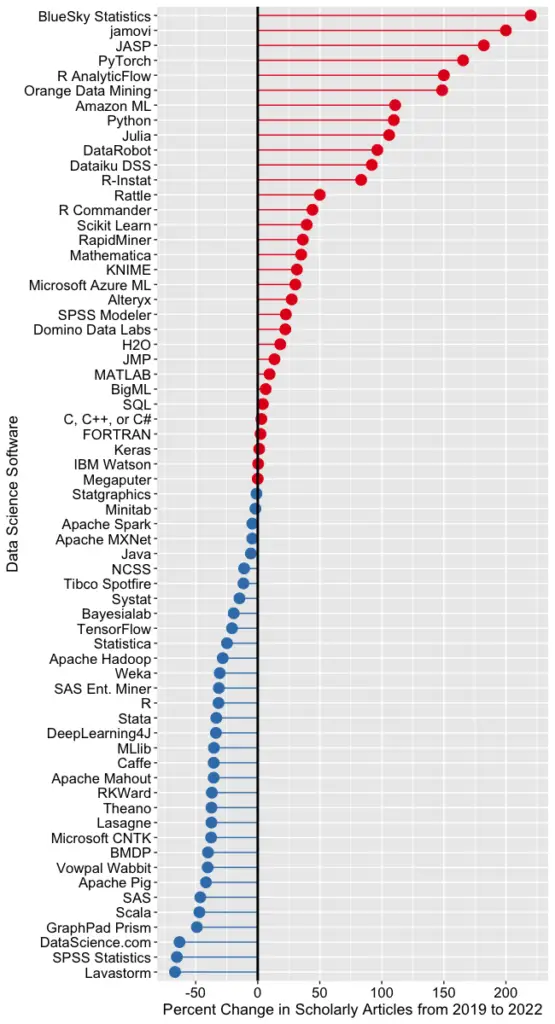
Figure 2c shows the percent change across those years, with the growing “hot” packages shown in red (right side) and the declining or “cooling” ones shown in blue (left side).

Figure 2c. Change in Google Scholar citation rate from 2019 to the most recent complete year, 2022. BlueSky (2,960%) and jamovi (452%) growth figures were shrunk to make the plot more legible.

Seven of the 14 fastest-growing packages are GUI front-ends that make R easy to use. BlueSky’s actual percent growth was 2,960%, which I recoded as 220% as the original value made the rest of the plot unreadable. In 2022 the company released a Mac version, and the Mayo Clinic announced its migration from JMP to BlueSky; both likely had an impact. Similarly, jamovi’s actual growth was 452%, which I recoded to 200. One of the reasons the R GUIs were able to obtain such high percentages of change is that they were all starting from low numbers compared to most of the other software. So be sure to look at the raw counts in Figure 2b to see the raw counts for all the R GUIs.

The most impressive point on this plot is the one for PyTorch. Back on 2a we see that PyTorch was the fifth most popular tool for data science. Here we see it’s also the third fastest growing. Being big and growing fast is quite an achievement!

Of the workflow-based tools, Orange Data Mining is growing the fastest. There is a good chance that the next time I collect this data Orange will surpass SPSS Modeler.

The big losers in Figure 2c are the expensive proprietary tools: SPSS, GraphPad Prism, SAS, BMDP, Stata, Statistica, and Systat. However, open-source R is also declining, perhaps a victim of Python’s rising popularity.

I’m particularly interested in the long-term trends of the classic statistics packages. So in Figure 2d, I have plotted the same scholarly-use data for 1995 through 2016.

Figure 2d. The number of Google Scholar citations for each classic statistics package per year from 1995 through 2016.

SPSS has a clear lead overall, but now you can see that its dominance peaked in 2009, and its use is in sharp decline. SAS never came close to SPSS’s level of dominance, and its usage peaked around 2010. GraphPad Prism followed a similar pattern, though it peaked a bit later, around 2013.

In Figure 2d, the extreme dominance of SPSS makes it hard to see long-term trends in the other software. To address this problem, I have removed SPSS and all the data from SAS except for 2014 and 2015. The result is shown in Figure 2e.

Figure 2e. The number of Google Scholar citations for each classic statistics package from 1995 through 2016, with SPSS removed and SAS included only in 2014 and 2015. The removal of SPSS and SAS expanded scale makes it easier to see the rapid growth of the less popular packages.

Figure 2e shows that most of the remaining packages grew steadily across the time period shown. R and Stata grew especially fast, as did Prism until 2012. The decline in the number of articles that used SPSS, SAS, or Prism is not balanced by the increase in the other software shown in this graph.

These results apply to scholarly articles in general. The results in specific fields or journals are likely to differ.

You can read the entire Popularity of Data Science Software here; the above discussion is just one section.