by Bob Muenchen & Sean MacKinnon
One of us (Muenchen) has been tracking The Popularity of Data Science Software using a variety of different approaches. One approach is to use Google Scholar to count the number of scholarly articles found each year for each software. He chose Google Scholar since it searches “across many disciplines and sources: articles, theses, books, abstracts, and court opinions, from academic publishers, professional societies, online repositories, universities, and other web sites.” Figure 1 shows the results from 1995 through 2016. Data collected in 2018 showed that while SPSS use dropped 39% drop from 2017 to 2018, its use was still 66% higher than R in 2018.
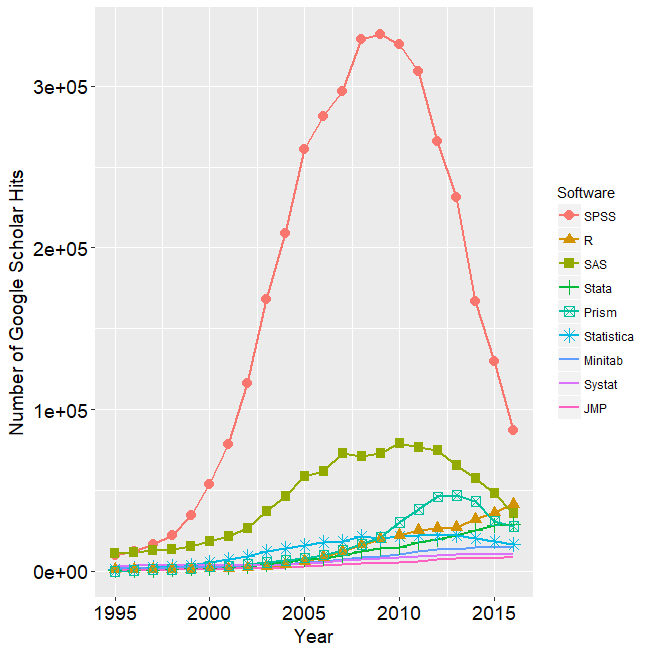
We see in the plot that SPSS was extremely dominant for most of that time period. Even after its precipitous decline, it still beats the rest by more than a 2 to 1 margin. Over the years, several people questioned the accuracy of Figure 1. In a time when scholarly publications are proliferating, how could SPSS use be in such decline?
One hypothesis that has often been suggested revolves around one of the most bizarre product name changes in the history of marketing. As a result of a legal battle for control of the name “SPSS”, the SPSS company changed the name of the product to “PASW”, an acronym for Predictive Analytics Software. The change made about as much sense as Coke people renaming Coke to “BSW”, for Bubbly Sugar Water. The battle was settled and in 2011 and the product name reverted back to SPSS.
Could that name change account for the apparent decline in its use? A search on Google Scholar from 2009 to 2012 on the string:
“PASW” -“SPSS” -“Amos”
yielded 12,000 hits. That sounds like quite a few, but when “SPSS” was substituted for “PASW” in that search, we found 701,000 references. At first glance, it seems that the scholarly use of SPSS was undercounted by 1.7%. However, when searching a vast volume of documents, each string may have problems with over-counting. For example, PASW stands for “Plant Available Soil Water” which accounts for 138 of those 12,000 articles. There may be many other such abbreviations. That’s the type of analysis Muenchen did several years ago, before concluding that PASW was more trouble than it was worth (details are here). In 2018 that search yields only 361 hits, and the title of the very first article begins with, “Projections Analysis of Surface Waves (PASW)…”
Muenchen’s hypothesis regarding the apparent decline of SPSS is that it was caused by competition. Back in 2002, SPSS shared the statistical software market with SAS and a couple of others. Its momentum carried it upward for a few more years, then the competition started chipping away at it. GraphPad Prism improved significantly with the release of its version 5 in 2007 and medical users of SPSS found an alternative that was as easy to use while focusing more on their needs. R added enough useful packages around the same time to become competitive. By now there are probably hundreds of packages that people can use to analyze data, only a few of which are shown in Figure 1.
Mackinnon remained skeptical of this hypothesis because the overall graph appears to show decreases in statistical software citation over time. This would seem to contradict evidence that the number of journal articles published has been increasing at about 3% per year over the last 3 centuries, and about 3.9% per year in the past decade (2018 STM Report, pg. 25). Thus, the total number of citations to statistical software as a collective group should be increasing concurrently with this overall increase.
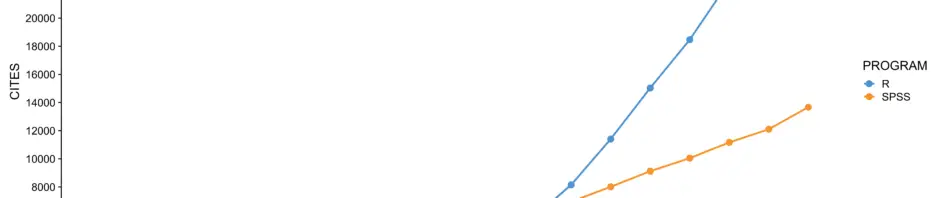
Mackinnon gathered data from a different source: Scopus. According to Wikipedia, “Scopus covers nearly 36,377 titles from approximately 11,678 publishers, of which 34,346 are peer-reviewed journals in top-level subject fields: life sciences, social sciences, physical sciences, and health sciences.” Mackinnon limited the search to reference lists, reasoning that such citations are likely an indicator of using the software in the paper. Two search strings were used:
REF(“the R software” OR “the R project” OR “r-project.org” OR “R development core”)
REF(SPSS)
These searches are being a bit generous to SPSS by including Modeler and AMOS, and very conservative for R by not including citations to common packages (e.g., ggplot2). The resulting data are plotted in Figure 2.

Above we see that the citations of R in scholarly journals exceeded that of SPSS back in 2012. However, the scale of Figure 2 tops out at 30,000 while Figure 1’s scale peaks at 300,000. Google is finding a lot more documents! So, which of these software packages is used the most in scholarly work? Good question! We would like to hear your comments below, especially from readers who collect data from other sources.
This makes a lot of sense. There are other pieces of software I’d like to include. Could you tells us how you obtained the data from Google Scholar for every year? Thank you
Hi Ywadwa,
There have been numerous attempts to automate the extraction of the counts from Google Scholar, but Google is very good at detecting automation and blocking it. So I end up repeating the search manually. That’s why I no longer go so far back in time. The search algorithm changes from year to year, so to make the numbers comparable, they must be done for whatever years you’re comparing. So now I gather only the last few years to get the trend.
Cheers,
Bob
Hi. It is called Jeong of South Korea. I am your old fan. I’ve been reading blog posts a long time ago. Thank you for writing a good article. There is one request drill section. I’m going to publish a book on statistics, can I quote Figure 1?
Best Regard,
Jeong
Hi Jeong,
Yes, you can use that figure in your book. Please cite it as Figure 2d from: http://r4stats.com/articles/popularity/. Good luck with your book!
Cheers,
Bob
The second dataset from scopus looks far more believeable. In my field (ecology) it is rare to some across any sort of serious analysis nowadays that isn’t done using R. I know that some fields still hold out (psychology) but they will be assimilated soon.
Hi Rob,
Haha, yes, the R Borg will assimilate even the psychologists soon! The leading cause of that will be the nice job that BlueSky Statistics and jamovi are doing in emulating SPSS:
http://r4stats.com/articles/software-reviews/r-gui-comparison/.
You might be interested in reading a study I co-authored on the popularity of R in ecology:
https://esajournals.onlinelibrary.wiley.com/doi/full/10.1002/ecs2.2567
Cheers,
Bob