Introduction
The R Commander is a free and open source user interface for the R software, one that focuses on helping users learn R commands by point-and-clicking their way through analyses. The R Commander is available on Windows, Mac, and Linux; there is no server version.
This is one of a series of reviews which aim to help non-programmers choose the user interface for R which is best for them. Each review also includes a cursory description of the programming support that each interface offers.

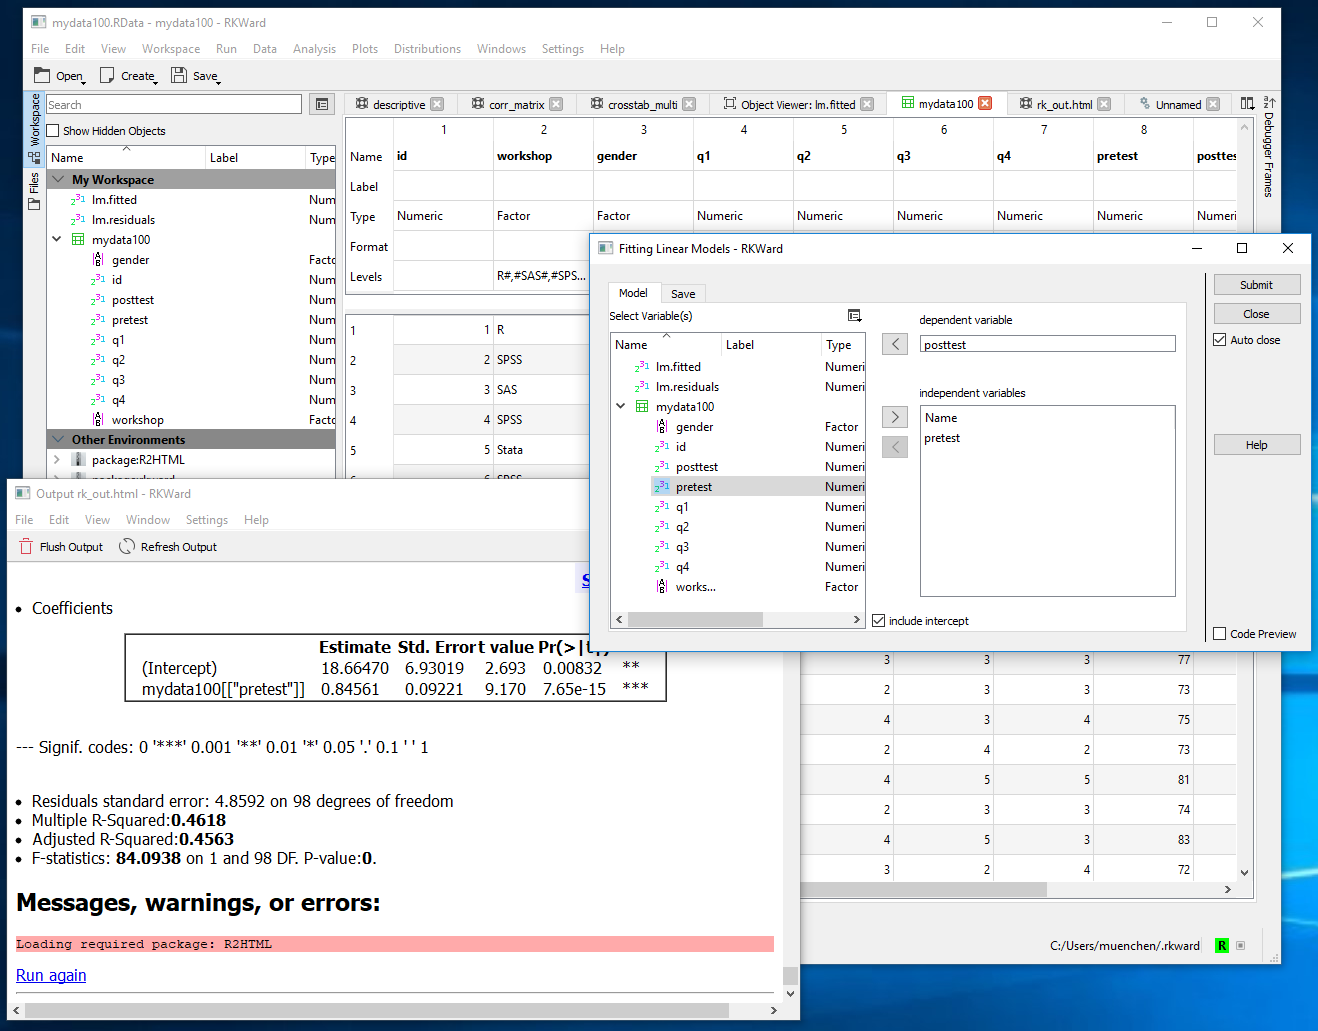
Figure 1. The main R Commander window is in the upper left. A typical dialog box is in the front, and the graph it created is on the right. The data editor is on the upper right.
Terminology
There are various definitions of user interface types, so here’s how I’ll be using these terms:
GUI = Graphical User Interface specifically using menus and dialog boxes to avoid having to type programming code. I do not include any assistance for programming in this definition. So GUI users are people who prefer using a GUI to perform their analyses. They don’t have the time or inclination to become good programmers.
IDE = Integrated Development Environment which helps programmers write code. I do not include point-and-click style menus and dialog boxes when using this term. IDE users are people who prefer to write R code to perform their analyses.
Installation
The various user interfaces available for R differ quite a lot in how they’re installed. Some, such as jamovi, BlueSky, or RKWard, install in a single step. Others, such as Deducer, install in multiple steps. Advanced computer users often don’t appreciate how lost beginners can become while attempting even a single-step installation. The HelpDesks at most universities are flooded with such calls at the beginning of each semester!
As described on the R Commander main web site, the installation basics are as follows:
- Download R from CRAN and install it in the manner appropriate to your operating system. If you have an old version of R — that is, older than the current version — then it’s generally a good idea to install the current version of R before installing the Rcmdr package. On Windows, opt for a customized startup and select the single-document interface (“SDI,” see the Windows notes below for details).
- On Mac OS X only, download and install XQuartz, and reboot your computer (see the Mac notes below for greater detail).
- Start R, and at the > command prompt, type the command install.packages(“Rcmdr”).
- Once it is installed, to load the Rcmdr package, just enter the command library(“Rcmdr”).
- Optionally install Pandoc and LaTeX to get publication-quality output (via “Tools> Install auxiliary software”)
Complete installation notes are here. They’re worth reading as they go on to point out several things that can go wrong. These include having an incompatible version of R (i.e. you skipped step 1), and R packages which fail to install.
While these multiple steps are more challenging that single-step installations, they are in line with the developer’s goal of helping people learn to program in R. That audience would have to learn to install R and R packages, then load packages anyway.
Plug-ins
When choosing a GUI, one of the most fundamental questions is: what can do for you? What the initial software installation of each GUI gets you is covered in the Graphics, Analysis, and Modeling section of this series of articles. Regardless of what comes built-in, it’s good to know how active the development community is. They contribute “plug-ins” which add new menus and dialog boxes to the GUI. This level of activity ranges from very low (RKWard, BlueSky, Deducer) through moderate (jamovi) to very active.
R Commander’s development community is by far the most active, with 45 add-ons available. The add-ons are stored on CRAN and installed like any other software. You install them using the install.packages function, then choose “Tools> Load Rcmdr plug-ins…”, select the plug-in, and click OK. R Commander will then tell you that you need to restart R Commander to have it appear on the menus. The R Commander stores your list of plug-ins in your .Rprofile and will edit it for you. That’s important as editing it is a non-trivial task (see Installation, step 6).
You can find a comprehensive list of plug-ins here: https://cran.r-project.org/web/packages/index.html.
Startup
Some user interfaces for R, such as jamovi and BlueSky Statistics, start by double-clicking on a single icon, which is great for people who prefer to not write code. Others, such as Deducer, have you start R, then load a package from your library, then call a function. That’s better for people looking to learn R, as those are among the first tasks they’ll have to learn anyway.
You start R Commander by first starting the RGUI program that comes with the main R package. You can also start it from any program that offers an R console, such as the one that comes with the main R installation. Once R is started, you start the R Commander by loading it from your library by typing this command and pressing the Enter key: “library(“Rcmdr”).” The main control screen will then appear (Figure 1, upper left) along with a graphics screen (Figure 1, right).
If you want to have the R Commander start automatically each time you start R, it’s possible to do so, but it is not a task for beginners. The R Commander creates an “.Rprofile” in your main directory and it includes instructions about how to “uncomment” a few lines by removing the leading “#” characters. However, files whose names consist only of an “.extension” are hidden by your file system, and if edited using the Notepad application, cannot be saved with that non-standard type of name. You can save it to a regular name like “Rprofile.txt”. You then must use operating system commands to rename it, as the Windows file manager also won’t let you choose a file name that is only an extension.
Data Editor
A data editor is a fundamental feature in data analysis software. It puts you in touch with your data, lets you get a feel for it, if only in a rough way. A data editor is such a simple concept that you might think there would be hardly any differences in how they work in different GUIs. While there are technical differences (single-click sorting, icons that show excluded observations, etc.), to a beginner what matters the most are the differences in simplicity. Some GUIs, including jamovi, Bluesky, let you create only what R calls a data frame. They use more common terminology and call it a data set: you create one, you save one, later you open one, then you use one. Others, such as RKWard trade this simplicity for the full R language perspective: a data set is stored in a workspace. So the process goes: you create a data set, you save a workspace, you open a workspace, and choose a data set from within it.
You start the R Commander’s Data Editor by choosing “Data> New data set…” You can enter data immediately, though at first the variables are named simply V1, V2… and the rows are named 1,2,3…. You can click on the names to change them (see Figure 2). Clicking on the “Add row” or “Add column” buttons do just that, though the Enter key is a quicker way to get a new row. You can enter simple numeric data or character data; no scientific notation, no dates. The latter is converted to a factor, but there is no way to enter the underlying values such as 1, 2 and have the editor display Male, Female, for example. That slows down data entry.
There is no way to enter or change any metadata other than variable and row names.
Saving the data provides a lesson on R data structures. Since you started the process by creating a new “data set”, you might start looking on the menus for where to save such a thing. Instead, you have to know that in R, data sets reside in something called a “workspace”. So “Data: New data set…” is balanced by “File: Save R workspace”. It would be nice if there was some instruction explaining this situation.

Figure 2. The R Commander’s data editor.
Data Import
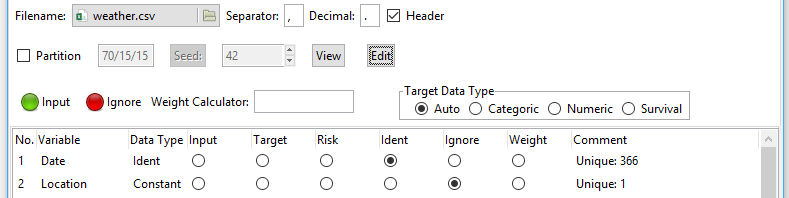
The R Commander can import the file formats: CSV, TXT, Excel, Minitab, SPSS, SAS, and Stata. It can even import data directly from a URL, which is a rare feature for a GUI. These are all located under “Data> Import Data”. A particularly handy feature is the ability to explore and load data sets that are included with installed packages. That’s done via “Data> Data in packages…”.
To get data from SQL database formats, you’ll have to use R code.
Data Management
It’s often said that 80% of data analysis time is spent preparing the data. Variables need to be transformed, recoded, or created; missing values need to be handled; datasets need to be stacked or merged, aggregated, transposed, or reshaped (e.g. from wide to long and back). A critically important aspect of data management is the ability to transform many variables at once. For example, social scientists need to recode many survey items, biologists need to take the logarithms of many variables. Doing such tasks one variable at a time is tedious. Some GUIs, such as BlueSky, handle nearly all of these challenges. Others, such as RKWard offer just a handful of data management functions.
The R Commander is able to recode many variables, adding an optional prefix to each name like “recoded_” to each variable that you choose to recode. It can also standardize many variables at once, but can only over-write the original values. Make a copy of your data set before doing that! Unfortunately, when it comes to other popular transformations such as the logarithm, you have to apply them one variable at time.
For reshaping data sets, the R Commander can stack one set of variables into a single variable and create a factor to classify those values, but it can’t take along other relevant variables, nor can it do the reverse of this process by going from “long” to “wide” data structures.
Overall, the R Commander offers a very useful set of data management tools:
For managing the active data set as a whole:
- View data
- Select active data set
- Refresh active data set
- Help on active data set
- Variables in active data set
- Set case names
- Subset active data set
- Sort active data set
- Aggregate variables in the active data set
- Remove row(s) from active data set
- Stack variables in active data set (half of reshaping discussed above)
- Remove cases with missing data
- Save active data set
- Export active data set
For managing variables in the active data set:
- Recode variables (able to do many variables)
- Compute new variables (can create only one new variable at a time)
- Add observation numbers to data set
- Standardize variables (able to do many variables at once)
- Convert numeric variables to factors
- Bin numeric variable
- Reorder factor levels
- Drop unused factor levels
- Define contrasts for a factor
- Rename variables
- Delete variables from data set
Menus & Dialog Boxes
The goal of pointing & clicking your way through an analysis is to save time by recognizing menu settings rather than spend it on the memorization and practice required by programming. Some GUIs, such as jamovi make this easy by sticking to menu standards and using simpler dialog boxes; others, such as RKWard, use non-standard menus that are unique to it and hence require more learning.
Figure 1 shows a common screen layout. The main R Commander window is in the upper left. A typical dialog box is in the front, and the graph it created is on the right. The data editor is on the upper right.
The R Commander’s menu structure contains some unique choices. No operations on data files are located on the usual “File” menu. For example, existing data sets or files are not opened using the usual “File> Open…”, but instead using “Data> Load data set…” menu. Also, everything on the models menu applies not to data but from models that you’ve already created from data. The other menus follow Windows standards. When switching between software packages, I found myself usually looking for data under the File menu. The rationale behind the R Commander’s approach is that the R function that opens files is named “load”. So this structure will help people learn more about R code (whether they’re headed that way or not!)
The dialog boxes have their own style too, but one that is easy to learn. Rather than have empty role boxes that you drag or click variables into, the role boxes contain the full list of relevant variables, and you click on one (or more) to select them (see “X variable (pick one) in Fig. 1). In the cases where there is an empty role box, or you double-click a variable name to move it from a list to box. The R Commander does a nice job of helping you avoid asking for absurdities, such as the mean of a factor, by not displaying them in certain dialog boxes.
The two objects you might be working on are shown on the toolbar right below the main menus. Clicking the “Data set:” tool will allow you to choose which data set most of the dialog boxes will refer to by default. That’s filled in automatically when you load, enter, or import a data set. Similarly, clicking the “Model:” tool will let you select a model which most of the choices on the Models menu will relate to. It too is filled in automatically each time you create a new model. See more on this in the Modeling section below.