I’ve updated The Popularity of Data Science Software‘s market share estimates based on scholarly articles. I posted it below, so you don’t have to sift through the main article to read the new section.
Scholarly Articles
Scholarly articles provide a rich source of information about data science tools. Because publishing requires significant effort, analyzing the type of data science tools used in scholarly articles provides a better picture of their popularity than a simple survey of tool usage. The more popular a software package is, the more likely it will appear in scholarly publications as an analysis tool or even as an object of study.
Since scholarly articles tend to use cutting-edge methods, the software used in them can be a leading indicator of where the overall market of data science software is headed. Google Scholar offers a way to measure such activity. However, no search of this magnitude is perfect; each will include some irrelevant articles and reject some relevant ones. The details of the search terms I used are complex enough to move to a companion article, How to Search For Data Science Articles.
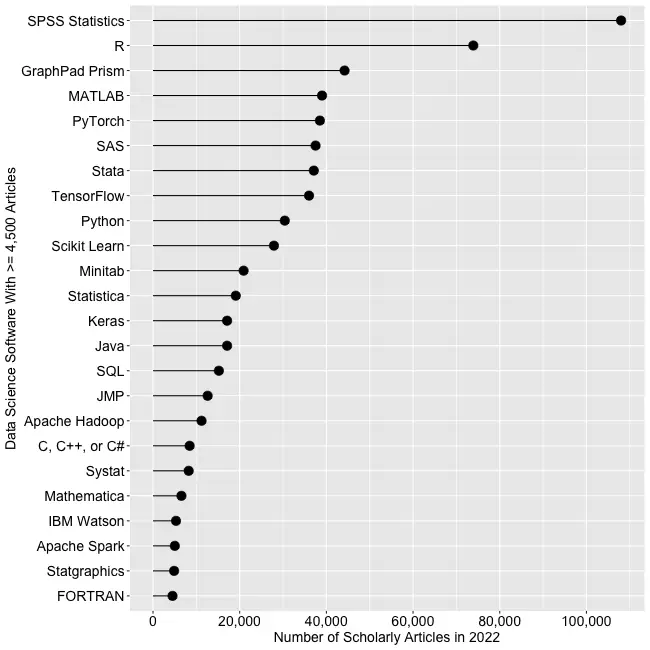
Figure 2a shows the number of articles found for the more popular software packages and languages (those with at least 4,500 articles) in the most recent complete year, 2022.

SPSS is the most popular package, as it has been for over 20 years. This may be due to its balance between power and its graphical user interface’s (GUI) ease of use. R is in second place with around two-thirds as many articles. It offers extreme power, but as with all languages, it requires memorizing and typing code. GraphPad Prism, another GUI-driven package, is in third place. The packages from MATLAB through TensorFlow are roughly at the same level. Next comes Python and Scikit Learn. The latter is a library for Python, so there is likely much overlap between those two. Note that the general-purpose languages: C, C++, C#, FORTRAN, Java, MATLAB, and Python are included only when found in combination with data science terms, so view those counts as more of an approximation than the rest. Old stalwart FORTRAN appears last in this plot. While its count seems close to zero, that’s due to the wide range of this scale, and its count is just over the 4,500-article cutoff for this plot.
Continuing on this scale would make the remaining packages appear too close to the y-axis to read, so Figure 2b shows the remaining software on a much smaller scale, with the y-axis going to only 4,500 rather than the 110,000 used in Figure 2a. I chose that cutoff value because it allows us to see two related sets of tools on the same plot: workflow tools and GUIs for the R language that make it work much like SPSS.

JASP and jamovi are both front-ends to the R language and are way out front in this category. The next R GUI is R Commander, with half as many citations. Still, that’s far more than the rest of the R GUIs: BlueSky Statistics, Rattle, RKWard, R-Instat, and R AnalyticFlow. While many of these have low counts, we’ll soon see that the use of nearly all is rapidly growing.
Workflow tools are controlled by drawing 2-dimensional flowcharts that direct the flow of data and models through the analysis process. That approach is slightly more complex to learn than SPSS’ simple menus and dialog boxes, but it gets closer to the complete flexibility of code. In order of citation count, these include RapidMiner, KNIME, Orange Data Mining, IBM SPSS Modeler, SAS Enterprise Miner, Alteryx, and R AnalyticFlow. From RapidMiner to KNIME, to SPSS Modeler, the citation rate approximately cuts in half each time. Orange Data Mining comes next, at around 30% less. KNIME, Orange, and R Analytic Flow are all free and open-source.
While Figures 2a and 2b help study market share now, they don’t show how things are changing. It would be ideal to have long-term growth trend graphs for each software, but collecting that much data is too time-consuming. Instead, I’ve collected data only for the years 2019 and 2022. This provides the data needed to study growth over that period.
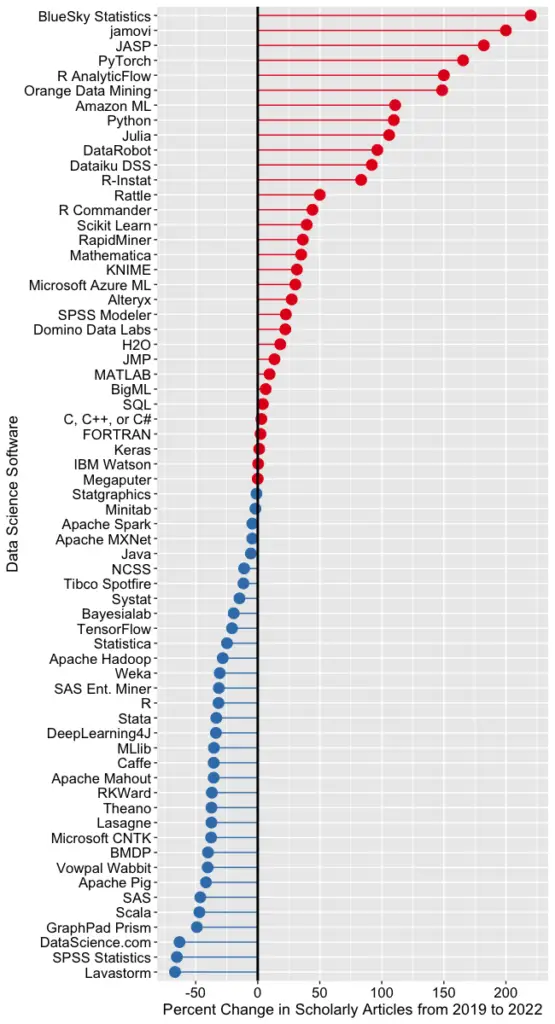
Figure 2c shows the percent change across those years, with the growing “hot” packages shown in red (right side) and the declining or “cooling” ones shown in blue (left side).

Seven of the 14 fastest-growing packages are GUI front-ends that make R easy to use. BlueSky’s actual percent growth was 2,960%, which I recoded as 220% as the original value made the rest of the plot unreadable. In 2022 the company released a Mac version, and the Mayo Clinic announced its migration from JMP to BlueSky; both likely had an impact. Similarly, jamovi’s actual growth was 452%, which I recoded to 200. One of the reasons the R GUIs were able to obtain such high percentages of change is that they were all starting from low numbers compared to most of the other software. So be sure to look at the raw counts in Figure 2b to see the raw counts for all the R GUIs.
The most impressive point on this plot is the one for PyTorch. Back on 2a we see that PyTorch was the fifth most popular tool for data science. Here we see it’s also the third fastest growing. Being big and growing fast is quite an achievement!
Of the workflow-based tools, Orange Data Mining is growing the fastest. There is a good chance that the next time I collect this data Orange will surpass SPSS Modeler.
The big losers in Figure 2c are the expensive proprietary tools: SPSS, GraphPad Prism, SAS, BMDP, Stata, Statistica, and Systat. However, open-source R is also declining, perhaps a victim of Python’s rising popularity.
I’m particularly interested in the long-term trends of the classic statistics packages. So in Figure 2d, I have plotted the same scholarly-use data for 1995 through 2016.

SPSS has a clear lead overall, but now you can see that its dominance peaked in 2009, and its use is in sharp decline. SAS never came close to SPSS’s level of dominance, and its usage peaked around 2010. GraphPad Prism followed a similar pattern, though it peaked a bit later, around 2013.
In Figure 2d, the extreme dominance of SPSS makes it hard to see long-term trends in the other software. To address this problem, I have removed SPSS and all the data from SAS except for 2014 and 2015. The result is shown in Figure 2e.

Figure 2e shows that most of the remaining packages grew steadily across the time period shown. R and Stata grew especially fast, as did Prism until 2012. The decline in the number of articles that used SPSS, SAS, or Prism is not balanced by the increase in the other software shown in this graph.
These results apply to scholarly articles in general. The results in specific fields or journals are likely to differ.
You can read the entire Popularity of Data Science Software here; the above discussion is just one section.