Way back in 2012 I published a forecast that showed that the use of R for scholarly publications would likely pass the use of SAS in 2015. But I didn’t believe the forecast since I expected the sharp decline in SAS and SPSS use to level off. In 2013, the trend accelerated and I expected R to pass SAS in the middle of 2014. As luck would have it, Google changed their algorithm, somehow finding vast additional quantities of SAS and SPSS articles. I just collected data on the most recent complete year of scholarly publications, and it turns out that 2015 was indeed the year that R passed SAS to garner the #2 position. Once again, models do better than “expert” opinion! I’ve updated The Popularity of Data Analysis Software to reflect this new data and include it here to save you the trouble of reading the whole 45 pages of it.
If you’re interested in learning R, you might consider reading my books R for SAS and SPSS Users, or R for Stata Users. I also teach workshops on R, but I’m currently booked through mid October, so please plan ahead.
Scholarly Articles
Scholarly articles are also rich in information and backed by significant amounts of effort. The more popular a software package is, the more likely it will appear in scholarly publications as an analysis tool or even an object of study. The software that is used in scholarly articles is what the next generation of analysts will graduate knowing, so it’s a leading indicator of where things are headed. Google Scholar offers a way to measure such activity. However, no search of this magnitude is perfect; each will include some irrelevant articles and reject some relevant ones. The details of the search terms I used are complex enough to move to a companion article, How to Search For Data Science Articles. Since Google regularly improves its search algorithm, each year I re-collect the data for all years.
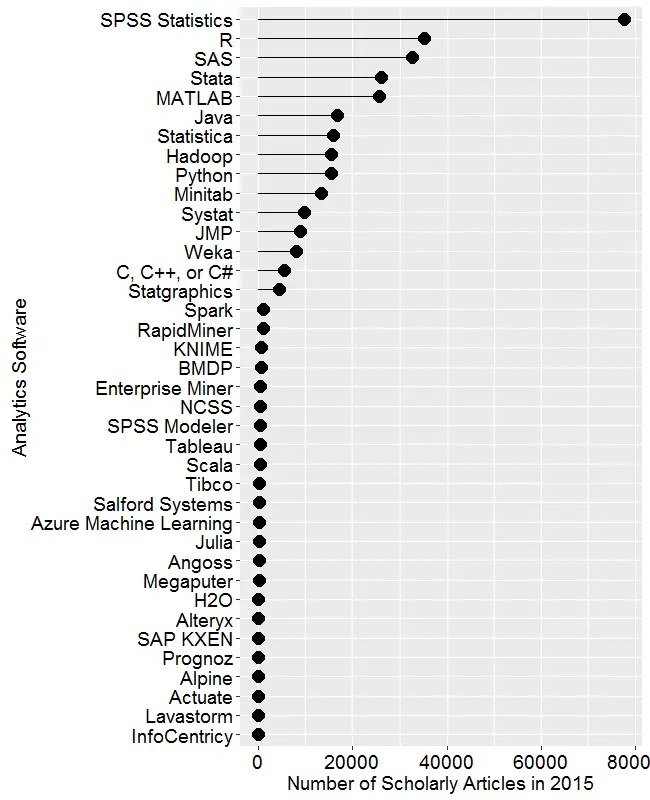
Figure 2a shows the number of articles found for each software package for the most recent complete year, 2015. SPSS is by far the most dominant package, as it has been for over 15 years. This may be due to its balance between power and ease-of-use. For the first time ever, R is in second place with around half as many articles. Although now in third place, SAS is nearly tied with R. Stata and MATLAB are essentially tied for fourth and fifth place. Starting with Java, usage slowly tapers off. Note that the general-purpose software C, C++, C#, MATLAB, Java, and Python are included only when found in combination with data science terms, so view those as much rougher counts than the rest. Since Scala and Julia have a heavy data science angle to them, I cut them some slack by not adding any data science terms to the search, not that it helped them much!
From Spark on down, the counts appear to be zero. That’s not the case, the counts are just very low compared to the more popular packages, used in tens of thousands articles. Figure 2b shows the software only for those packages that have fewer than 1,200 articles (i.e. the bottom part of Fig. 2a), so we can see how they compare. Spark and RapidMiner top out the list of these packages, followed by KNIME and BMDP. There’s a slow decline in the group that goes from Enterprise Miner to Salford Systems. Then comes a group of mostly relative new arrivals beginning with Microsoft’s Azure Machine Learning. A package that’s not a new arrival is from Megaputer, whose Polyanalyst software has been around for many years now, with little progress to show for it. Dead last is Lavastorm, which to my knowledge is the only commercial package that includes Tibco’s internally written version of R, TERR.

Figures 2a and 2b are useful for studying market share as it is now, but they don’t show how things are changing. It would be ideal to have long-term growth trend graphs for each of the analytics packages, but collecting such data is too time consuming since it must be re-collected every year (since Google’s search algorithms change). What I’ve done instead is collect data only for the past two complete years, 2014 and 2015. Figure 2c shows the percent change across those years, with the “hot” packages whose use is growing shown in red. Those whose use is declining or “cooling” are shown in blue. Since the number of articles tends to be in the thousands or tens of thousands, I have removed any software that had fewer than 500 articles in 2014.

Python is the fastest growing. Note that the Python figures are strictly for data science use as defined here. The open-source KNIME and RapidMiner are the second and third fastest growing, respectively. Both use the easy yet powerful workflow approach to data science. Figure 2b showed that RapidMiner has almost twice the marketshare of KNIME, but here we see use of KNIME is growing faster. That may be due to KNIME’s greater customer satisfaction, as shown in the Rexer Analytics Data Science Survey. The companies are two of only four chosen by IT advisory firm Gartner, Inc. as having both a complete vision of the future and the ability to execute that vision (Fig. 3a).
R is in fourth place in growth, and given its second place in overall marketshare, it is in an enviable position.
At the other end of the scale are SPSS and SAS, both of which declined in use by 25% or more. Recall that Fig. 2a shows that despite recent years of decline, SPSS is still extremely dominant for scholarly use. Hadoop use declined slightly, perhaps as people turned to alternatives Spark and H2O.
I’m particularly interested in the long-term trends of the classic statistics packages. So in Figure 2d I’ve plotted the same scholarly-use data for 1995 through 2015, the last complete year of data when this graph was made. As in Figure 2a, SPSS has a clear lead, but now you can see that its dominance peaked in 2008 and its use is in sharp decline. SAS never came close to SPSS’ level of dominance, and it also peaked around 2008. Note that the decline in the number of articles that used SPSS or SAS is not balanced by the increase in the other software shown in this particular graph. However, if you add up all the other software shown in Figure 2a, you come close. There still seems to be a slight decline in people reporting the particular software tool they used.

Since SAS and SPSS dominate the vertical space in Figure 2d by such a wide margin, I removed those two curves, leaving only a single point of SAS usage in 2015. The the result is shown in Figure 2e. Freeing up so much space in the plot now allows us to see that the growth in the use of R is quite rapid and is pulling away from the pack (recall that the curve for SAS has a steep downward slope). If the current trends continue, R will cross SPSS to become the #1 software for scholarly data science use by the end of 2017. Stata use is also growing more quickly than the rest. Note that trends have shifted before as discussed here. The use of Statistica, Minitab, Systat and JMP are next in popularity, respectively, with their growth roughly parallel to one another.

Using a logarithmic y-axis scales down the more popular packages, allowing us to see the full picture in a single image (Figure 2f.) This view makes it more clear that R use has passed that of SAS, and that Stata use is closing in on it. However, even when one studies the y-axis values carefully, it can be hard to grasp how much the logarithmic transformation has changed the values. For example, in 2015 value for SPSS is well over twice the value for R. The original scale shown in Figure 2d makes that quite clear.

Interesting, and thank you for the huge effort with those queries.
Would it be better to show the numbers as fraction of all papers using the tool? Overall publication volume may be increasing (or decreasing) for reasons that has nothing to do with the popularity of the tools?
Hi Cybaea,
I actually did that graph but the pattern was so similar that I skipped talking about it.
Cheers,
Bob
Bob,
I’m having a hard time understanding Figure 2e without seeing the total number of articles. Are Minitab and its mates gaining in percent of articles as well as absolutely?
Hi Pat,
Figure 2e is just the raw counts of articles for those packages for each year. SAS is shown just as a single point in 2015 because I’m removing the SAS and SPSS curves to make room for the other data.
Cheers,
Bob
Bob:
I am very interested in software usage since I want to use the most popular statistical software for examples in my books on statistical modeling. I became interested in software when I served as Software Reviews editor for The American Statistician from 1997 to 2009, some 13 years. I am also an assoc editor for 6 stat journals and frequently review books for publishers. I very rarely see SPSS used for examples in the journal articles and books I review. In fact I can’t recall the last time I saw a new book using SPSS. Even when I taught a number of courses with Statistics.com (from 2003 until the end of 2015), I asked students which stat package they used or preferred. Out of a 20 student average for the five courses and nine classes I taught each year, perhaps one student used SPSS per class. They usually had some problems because SPSS was behind R, Stata, and SAS in its capabilities for modeling.newly developed procedures and diagnostics.
But i see from your stats that SPSS appears to be by far the most used stat package in journal articles and books. I’m not doubting you, but I find it contrary to my experience. Perhaps you could email me separately and let me know where this usage is coming from. I never expected to see this type of result. I did beta testing for SPSS all the way until 2005 until I became frustrated with it not keeping up with the developments many new procedures being developed, and which were being added to other stat software (R and Stata in particular).
From your statistics it appears that SPSS is by far the most frequently used package for examples in journal articles and books. This is totally amazing to me. I learned something today.
By the way, it’s pleasing to see that our book, “R for Stata Users”, is still selling well after 6 years on the market.
Thanks for doing the research in producing the usage of various stat packages. It takes a lot of work.
Hi Joe,
It’s nice to hear from you! You were not only the Software Reviews Editor for American Statistician, but as I recall, you wrote many of the excellent reviews. What I’ve tried to do is fully document every step so that anyone can replicate it. The details are here:
http://r4stats.com/articles/how-to-search-for-data-science-articles
but you can skip many of those and go directly to the search string used by each package and use it at http://scholar.google.com. Once you do a search, it offers to let you focus down to any time period. You can fill in 2015-2015 for example to compare quickly SPSS, then change the search to Stata or whatever. I have notes by every string for things to be careful of. For example, “stata” means “was” in Spanish so you have to be VERY careful with that one. Peter Hedström and I worked quite a while to get the Stata string as accurate as it could be. The tricky part of the search often comes after the first 100 articles. Those are usually good hits, but afterwards, the many, many places where a search can fail becomes obvious.
Here at UT, we survey the entire campus on what software they use, and we also monitor software downloads. By both measures, our campus use of stat package has fairly closely matched my Google Scholar results, except that JMP is far more popular than Stata due to its use in Stat 201. Here, Stata is used by only 3 or 4 departments. SPSS, SAS, and R, are used everywhere & our March survey just had R beat out SAS by a slim margin. SPSS is #1 here, but by a much slimmer margin than on Google Scholar.
Cheers,
Bob
Hi Bob,
Concerning your google scholar hits (e.g. fig 2d). The sharp decline in SPSS in 2009 coincides with a change in the way SPSS is cited – changing from “SPSS inc” to “IBM” – this change coincides perfectly with the sharp drop. Hence I find it more plausible that SPSS isn’t being abandoned “en mass”. No, more likely it’s still similar, with the sharp decline simply meaning people are switching to the latest version of SPSS and associated change in citation format. To give a fair view the search should include the new citation form. Check: www-01.ibm.com/support/docview.wss?uid=swg21476197
Best,
Marco Visser
Hi Marco,
Thanks for the interesting hypothesis! The exact string that I used for each package is documented here:
http://r4stats.com/articles/how-to-search-for-data-science-articles
The amount of hours of testing that went into those strings is embarrassingly insane. Some of them took over 20 hours and there are 30+ packages. The optimum search I found to avoid the problem you describe (and many others) is this:
SPSS -“SPSS Modeler” -“Amos”
Which matches both the old and new citations. What is misses is the year they renamed SPSS to PASW. From what I saw, very few people bothered using that temporary name.
Every year I try new variations to see if I can improve on these strings. None are perfect, so I invite people to try variations and send me their results. The search strings for Stata and Statistica were greatly improved by contributors whom I list in the acknowledgements.
Cheers,
Bob
Hi Bob,
Thanks, I may indeed give that a try. My guess is that your term SPSS -“SPSS Modeler” -“Amos” should catch the new “IBM corp” citation (as people will generally state “we used SPSS v X.Y (IBM corp, 20XX)”.
You see the thing that bothered me is, when I look at your fig 2d, I can’t help but notice that the total sum of hits is dropping considerably. I don’t know how to explain that, as I would rather expect to see an increase. The above hypothesis was an attempt to explain the drop in the total # of hits.
I have no doubt that compiling this is a great deal of work! It’s appreciated.
Thanks!
Marco
the rise and fall of SAS and SPSS (more so) corresponds, nearly congruent, to the rise and fall of FIRE (into the Great Recession), which implies that Li’s Copula and similar chicanery were begat by Excel and SPSS. lite weights in the quant world, by some measures. hopefully there won’t be a repetition.
Very interesting! I do, however, worry about some selection issues in your data. In economics, it is quite rare for papers to specify the software used. This might be true for other disciplines too, but I wouldn’t know. My impression is that Stata is by far the most used software package used by economists, followed by R. Matlab is also widely used, but more for simulation and modelling than for statistical analysis.
Thus, since reporting standards as well as software usage varies across disciplines, there’s likely to be some bias in your numbers. If economics is the outlier here, I would expect that to depress the numbers for Stata, and to a lesser extent for R, compared to SAS (relatively rarely used) and SPSS (don’t think I’ve ever seen it used by an economist).
Hi Adrian,
I agree, every one of the measures I report has flaws. However, across them all you get a picture that I find very useful. We survey our faculty, staff, and students every year, and in March R just surpassed SAS for the first time. SPSS is still #1 and yes, Stata is #1 in the Econ department and only two others on campus.
Cheers,
Bob
Adrian, I agree that the software used in journal articles is seldom mentioned, unless there is a reason to, but one can usually tell what software is used for examples if the author(s) post a table or regression output in the article. I also don;t see SPSS used in journals related to straight mathematical statistics, or in areas like economics, ecology, health outcomes, medical statistics, astrostatistics, or transportation. I can’t think of any offhand in sports statistics, but I suspect that there might be the occasional article. I think that SPSS is strong in traditional social science and education areas; e.g. political science, sociology, psychology, and education. From Bob’s analysis, there must be a host of journals in these areas in order to show SPSS used so much. I don’t doubt his figures — he is very good at doing this research. But I have to admit, I am still in shock. I seriously would have bet a lot of money in putting SPSS far behind R, SAS, and Stata. I suppose its a good thing I don’t gamble.
We need to engage more into R, not practicing so much of it so much.
Hi Patrick,
I’m not sure what you mean. Can you clarify?
Cheers,
Bob