Advanced Analytics Software’s Most Important Feature? Gartner Says it’s VCF

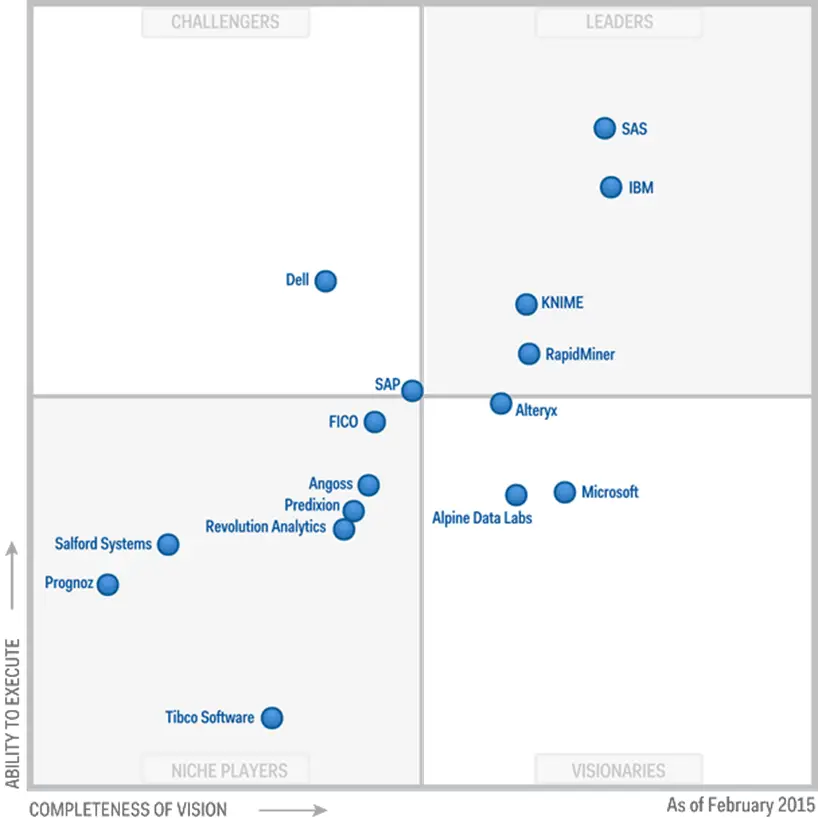
The IT research firm, Gartner, Inc. has released its February 2016 report, Magic Quadrant for Advanced Analytics Platforms. The report’s main graph shows the completeness of each company’s vision plotted against its ability to achieve that vision (Figure 1.) I include this plot each year in my continuously updated article, The Popularity of Data Analysis Software, along with a brief summary of its major points. The full report is always interesting reading and, if you act fast, you can download it free from RapidMiner’s web site.

Figure 1. Gartner Magic Quadrant for 2016. What’s missing?

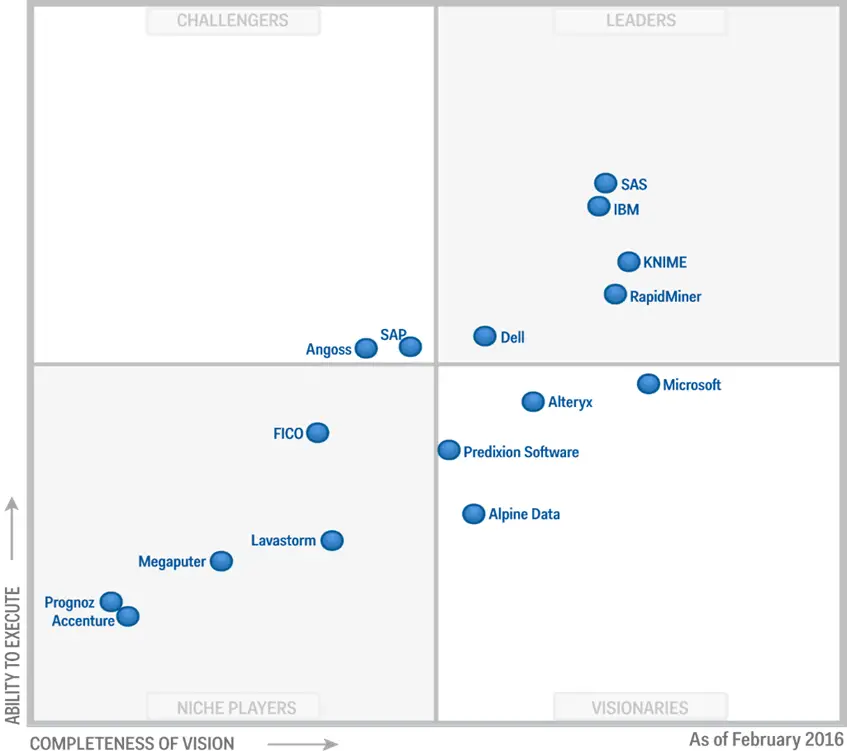
If you compare Figure 1 to last year’s plot (Figure 2), you’ll see a few noteworthy changes, but you’re unlikely to catch the radical shift that has occurred between the two. Both KNIME and RapidMiner have increased their scores slightly in both dimensions. KNIME is now rated as having the greatest vision within the Leaders quadrant. Given how much smaller KNIME Inc. is than IBM and SAS Institute, that’s quite an accomplishment. Dell has joined them in the Leaders quadrant through its acquisition of Statistica. Microsoft increased its completeness of vison, in part by buying Revolution Analytics. Accenture joined the category through its acquisition of i4C Analytics. LavaStorm and Megaputer entered the plot in 2016, though Gartner doesn’t specify why. These are all interesting changes, but they don’t represent the biggest change of all.

The watershed change between these two plots is hinted at by two companies that are missing in the more recent one: Salford Systems and Tibco. The important thing is why they’re missing. Gartner excluded them this year, “…due to not satisfying the [new] visual composition framework [VCF] inclusion criteria.” VCF is the term they’re using to describe the workflow (also called streams or flowcharts) style of Graphical User Interface (GUI). To be included in the 2016 plot, companies must have offered software that uses the workflow GUI. What Garter is saying is, in essence, advanced analytics software that does not use the workflow interface is not worth following!

Gartner2015

Figure 2. Gartner Magic Quadrant for 2015.

Though the VCF terminology is new, I’ve long advocated its advantages (see What’s Missing From R). As I described there:

“While menu-driven interfaces such as R Commander, Deducer or SPSS are somewhat easier to learn, the flowchart interface has two important advantages. First, you can often get a grasp of the big picture as you see steps such as separate files merging into one, or several analyses coming out of a particular data set. Second, and more important, you have a precise record of every step in your analysis. This allows you to repeat an analysis simply by changing the data inputs. Instead, menu-driven interfaces require that you switch to the programs that they create in the background if you need to automatically re-run many previous steps. That’s fine if you’re a programmer, but if you were a good programmer, you probably would not have been using that type of interface in the first place!”

As a programming-oriented consultant who works with many GUI-oriented clients, I also appreciate the blend of capabilities that workflow GUIs provide. My clients can set up the level of analysis they’re comfortable with, and if I need to add some custom programming, I can do so in R or Python, blending my code right into their workflow. We can collaborate, each using his or her preferred approach. If my code is widely applicable, I can put it into distribution as a node icon that anyone can drag into their workflow diagram.

The Gartner report offers a more detailed list of workflow features. They state that such interfaces should support:

  • Interactive design of workflows from data sources to visualization, modeling and deployment using dragging and dropping of building blocks on a visual pallet
  • Ability to parameterize the building blocks
  • Ability to save workflows into files and libraries for later reuse
  • Creation of new building blocks by composing sets of building blocks
  • Creation of new building blocks by allowing a scripting language (R, JavaScript, Python and others) to describe the functionality of the input/output behavior

I would add the ability to color-code and label sections of the workflow diagram. That, combined with the creation of metanodes or supernodes (creating one new building block from a set of others) help keep a complex workflow readable.

Implications

If Gartner’s shift in perspective resulted in them dropping only two companies from their reports, does this shift really amount to much of a change? Hasn’t it already been well noted and dealt with? No, the plot is done at the company level. If it were done at the product level, many popular packages such as SAS (with its default Display Manager System interface) and SPSS Statistics would be excluded.

The fields of statistics, machine learning, and artificial intelligence have been combined psychologically by their inclusion into broader concepts such as advanced analytics or data science. But the separation of those fields is still quite apparent in the software tools themselves. Tools that have their historical roots in machine learning and artificial intelligence are far more likely to have implemented workflow GUIs.  However, while they have a more useful GUI, they tend to still lack a full array of common statistical methods. For example, KNIME and RapidMiner can only handle very simple analysis of variance problems. When such companies turn their attention to this deficit, the more statistically oriented companies will face much stiffer completion. Recent versions of KNIME have already made progress on this front.

SPSS Modeler can access the full array of SPSS Statistics routines through its dialog boxes, but the two products lack full integration. Most users of SPSS Statistics are unaware that IBM offers control of their software through a better interface. IBM could integrate the Modeler interface into SPSS Statistics so that all its users would see that interface when they start the software. Making their standard menu choices could begin building a workflow diagram. SPSS Modeler could still be sold as a separate package, one that added features to SPSS Statistics’ workflow interface.

A company that is on the cutting edge of GUI design is SAS Institute. Their SAS Studio is, to the best of my knowledge, unique in its ability to offer four major ways of working. Its program editor lets you type code from memory using features far advanced from their aging Display Manager System. It also offers a “snippets” feature that lets you call up code templates for common tasks and edit them before execution. That still requires some programming knowledge, but users can depend less on their memory. The software also has a menu & dialog approach like SPSS Statistics, and it even has a workflow interface. Kudos to SAS Institute for providing so much flexibility! When students download the SAS University Edition directly from SAS Institute, this is the only interface they see.

SAS Studio currently supports a small, but very useful, percent of SAS’ overall capability. That needs to be expanded to provide as close to 100% coverage as possible. If the company can eventually phase out their many other GUIs (Enterprise Guide, Enterprise Miner, SAS/Assist, Display Manager System, SAS/IML Studio, etc.), merging that capability into SAS Studio, they might finally earn a reputation for ease of use that they have lacked.

In conclusion, the workflow GUI has already become a major type of interface for advanced analytics. My hat is off to the Gartner Group for taking a stand on encouraging its use. In the coming years, we can expect to see the machine learning/AI software adding statistical features, and the statistically oriented companies continuing to add more to their workflow capabilities until the two groups meet in the middle. The companies that get there first will have a significant strategic advantage.

Acknowledgements

Thanks to Jon Peck for suggestions that improved this post.
Business Intelligence and Data Science Groups in East Tennessee

The Knoxville area has four groups that help people learn about business intelligence and data science.

The Knoxville R Users Group (KRUG) focuses on the free and open source R language. Each meeting begins with a bit of socializing followed by a series of talks given by its members or guests. The talks range from brief five-minute demos of an R function to 45-minute in-depth coverage of some method of analysis. Beginning tutorials on R are occasionally offered as well. Membership is free of charge, but donations are accepted to defray the cost of snacks and web site maintenance. You can join at the KRUG web site.

Data Science KNX is a group of people interested in the broad field of data science. Members range from beginners to experts. As their web site states, their “…aim is to maintain a forum for connecting people around data science specific topics such as tutorials and their applications, local success stories, discussions of new technologies, and best practices. All are welcome to attend, network, and present!” You can go here to join at the Data Science KNX web site. Membership is free, though the group gladly accepts donations to help defray the costs of the pizza and beer provided at their meetings.

The East Tennessee Business Intelligence Users Group is “committed to learning, sharing, and advancing the field of Business Intelligence in the East Tennessee region.” They meet several times each year featuring speakers who demonstrate business intelligence software such as IBM’s Watson and Microsoft’s PowerBI. Meetings are at lunch and a meal is provided by sponsoring companies. Membership is free, and so is the lunch! You can join the group at their web site.

Each spring and fall, The University of Tennessee’s Department of Business Analytics and Statistics offers a Business Analytics Forum that features speakers from both industry and academia. The group consists of non-competing companies for whom business analytics is an important part of their operation. Forum members work together to share best practices and to develop more effective strategies. The forum is open to paid members only and you can join on their registration page.

Using Discussion Forum Activity to Estimate Analytics Software Market Share

I’m finally getting around to overhauling the Discussion Forum Activity section of The Popularity of Data Analysis Software. To save you the trouble of reading all 43 pages, I’m posting just this section below.

Discussion Forum Activity

Another way to measure software popularity is to see how many people are helping one another use each package or language. While such data is readily available, it too has its problems. Menu-driven software like SPSS or workflow-driven software such as KNIME are quite easy to use and tend to generate fewer questions. Software controlled by programming requires the memorization of many commands and requiring more support. Even within languages, some are harder to use than others, generating more questions (see Why R is Hard to Learn).

Another problem with this type of data is that there are many places to ask questions and each has its own focus. Some are interested in a classical statistics perspective while others have a broad view of software as general-purpose programming languages. In recent years, companies have set up support sites within their main corporate web site, further splintering the places you can go to get help. Usage data for such sites is not readily available.

Another problem is that it’s not as easy to use logic to focus in on specific types of questions as it was with the data from job advertisements and scholarly articles discussed earlier. It’s also not easy to get the data across time to allow us to study trends.  Finally, the things such sites measure include: software group members (a.k.a. followers), individual topics (a.k.a. questions or threads), and total comments across all topics (a.k.a. total posts). This makes combining counts across sites problematic.

Two of the biggest sites used to discuss software are LinkedIn and Quora. They both display the number of people who follow each software topic, so combining their figures makes sense. However, since the sites lack any focus on analytics, I have not collected their data on general purpose languages like Java, MATLAB, Python or variants of C. The results of data collected on 10/17/2015 are shown here:

LinkedIn_Quora_2015

We see that R is the dominant software and that moving down through SAS, SPSS, and Stata results in a loss of roughly half the number of people in each step. Lavastorm follows Stata, but I find it odd that there was absolutely zero discussion of Lavastorm on Quora. The last bar that you can even see on this plot is the 62 people who follow Minitab. All the ones below that have tiny audiences of fewer than 10.

Next let’s examine two sites that focus only on statistical questions: Talk Stats and Cross Validated. They both report the number of questions (a.k.a. threads) for a given piece of software, allowing me to total their counts:

CrossValidated_TalkStats_2015

We see that R has a 4-to-1 lead over the next most popular package, SPSS. Stata comes in at 3rd place, followed by SAS. The fact that SAS is in fourth place here may be due to the fact that it is strong in data management and report writing, which are not the types of questions that these two sites focus on. Although MATLAB and Python are general purpose languages, I include them here because the questions on this site are within the realm of analytics. Note that I collected data on as many packages as were shown in the previous graph, but those not shown have a count of zero. Julia appears to have a count of zero due to the scale of the graph, but it actually had 5 questions on Cross Validated.

If you found this interesting, you can read about the results of other surveys and several other ways to measure software popularity here.

Is your organization still learning R?  I’d be happy to stop by and help. I also have a workshop, R for SAS, SPSS and Stata Users, on DataCamp.com. If you found this post useful, I invite you to follow me on Twitter.

I’ve Been Replaced by an Analytics Robot

It was only a few years ago when the N.Y. Times declared my job “sexy”.  My old job title of statistician had sounded dull and stodgy, but then it became filled with exciting jargon: I’m a data scientist doing predictive analytics with (occasionally) big data. Three hot buzzwords in a single job description! However, in recent years, the powerful technology that has made my job so buzzworthy has me contemplating the future of the field. Computer programs that automatically generate complex models are becoming commonplace. Rob Hyndman’s forecast package for R, SAS Institite’s Forecast Studio, and IBM’s SPSS Forecasting offer the ability to generate forecasts that used to require years of training to develop. Similar tools are now available for other types of models as well.

Countless other careers have been eliminated due to new technology. The United States previously had over 70% of the population employed in farming and fewer than 2% are farmers today. Things change, people move on to other careers. The KDnuggests web site recently asked its readers, “When will most expert-level Predictive Analytics/Data Science tasks – currently done by human Data Scientists – be automated?” Fifty-one percent of the respondents – most of them data scientists themselves – estimated that this would happen within 10 years. Not all the respondents had such a dismal view though; 19% said that this would never happen.

My brain being analyzed by the machine that replaced my brain!
My brain being analyzed by the machine that replaced my brain! (Photograpy by Mike O’Neil)

If you had asked me in 1980 what would be the very last part of my job to be eliminated through automation, I probably would have said: brain wave analysis. It had far more steps involved than any other type of work I did. We were measuring the electrical activity of many parts of the brain, at many frequencies, thousands of times per second. An analysis that simply compared two groups would take many weeks of full-time work. Surprisingly, this was the first part of my job to be eliminated. However, our statistical consulting team supports many different departments, so I didn’t really notice when work stopped arriving from the EEG Lab. Years later I got a call from the new lab director offering to introduce me to my replacement: a “robot” named LORETA.

When I visited the lab, I was outfitted with the usual “bathing cap” full of electrodes. EEG paste (essentially K-Y jelly) was squirted into a hole in each electrode to ensure a good contact and the machine began recording my brain waves. I used bio-feedback to generate alpha waves which made a car go around a track in a simple video game. Your brain creates alpha waves when you get into a very relaxed, meditative state. Moments after I finished, LORETA had already analyzed my brain waves. “She” had done several weeks of analysis in just a few moments.

So that part of my career ended years ago, but I didn’t really notice it at the time. I was too busy using the time LORETA freed up to learn image analysis using ImageJ, text mining using WordStat and SAS Text Miner, and an endless variety of tasks using the amazing
R language. I’ve never had a moment when there wasn’t plenty of interesting new work to do.

There’s another aspect to my field that’s easy to overlook. When I began my career, 90% of the time was spent “battling” computers. They were incredibly difficult to operate. Today someone may send you a data file and you’ll be able to see the data moments after receiving it. In 1980 data arrived on tapes, and every computer manufacturer used a different tape format, each in numerous incompatible variations. Unless you had a copy of the program that created a tape, it might take days of tedious programming just to get the data off of it. Even asking the computer to run a program required error-prone Job Control Language. So from that perspective, easier-to-use computing technology has already eliminated 90% of what my job used to be. It wasn’t the interesting part of the job, so it was a change for the better.

Will the burgeoning field of data science eventually put itself out of business by developing a LORETA for every problem that needs to be solved? Will we just be letting our Star-Trek-class computers and robots do our work for us while we lounge around self-actualizing? Perhaps some day, but I doubt it will happen any time soon!

I invite you to follow me here or at http://twitter.com/BobMuenchen. If you’re interested in learning R, DataCamp.com offers my 16-hour interactive workshop, R for SAS, SPSS and Stata Users for $25. That’s a monthly fee, but it definitely won’t take you a month to take it!  For students & academics, it’s $9. I also do R training on-site.

r4stats.com 2014 in review

The WordPress.com stats helper monkeys prepared a 2014 annual report for this blog.

Here’s an excerpt:

The Louvre Museum has 8.5 million visitors per year. This blog was viewed about 260,000 times in 2014. If it were an exhibit at the Louvre Museum, it would take about 11 days for that many people to see it.

Click here to see the complete report.

SAS is #1…In Plans to Discontinue Use

I’ve been tracking The Popularity of Data Analysis Software for many years now, and a clear trend is the decline of the market share of the bigger analytics firms, notably SAS and SPSS. Many people have interpreted my comments as implying the decline in the revenue of those companies. But the fields involved in analytics (statistics, data mining, analytics, data science, etc.) have been exploding in popularity, so having a smaller slice of a much bigger pie still leaves billions in revenue for the big players.

Each year, the Gartner Group, “the world’s leading information technology research and advisory company”, collects data in a survey of the customers of 42 business intelligence firms. They recently released the data on the customers’ plans to discontinue use of their current software in one to three years. The results are shown in the figure below. Over 16% of the SAS Institute customers surveyed reported considering discontinuing their use of the software, the highest of any of the vendors shown. It will be interesting to see if this will actually lead to an eventual decline in revenue. Although I have helped quite a few organizations migrate from SAS to R, I would be surprised to see SAS Institute’s revenue decline. They offer excellent software and service which I still use, though not anywhere near as much as R.

The full Gartner report is available here.

SAS Attrition Plot

Adding the SPSS MEAN.n Function to R

SPSS contains a very useful set of functions that R lacks. If you’re lucky enough to have access to SPSS, you can use SPSS and R very well together. If not, it’s easy to add these functions to R. The functions perform calculations across values within each observation. Rather than limit you to removing missing values or not, they let you specify how many valid values you want before setting the result to missing. For example in SPSS,
MEAN.5(Q1 TO Q10) asks for the mean only if at least five of the ten variables have valid values. Otherwise the result will be a missing value. This “.n” extension is also available for SPSS’ SUM, SD, VARIANCE, MIN and MAX functions.

Let’s now take a look at how to do this in R. First we’ll create some data with different numbers of missing values for each observations.

> q1 <- c(1, 1, 1)
> q2 <- c(2, 2, NA)
> q3 <- c(3, NA, NA)
> df <- data.frame(q1, q2, q3)
> df
q1 q2  q3
1 1 2   3
2 1 2  NA
3 1 NA NA

R already has a mean function, but it lacks a function to count the number of valid values. A common way to do this in R is to use the is.na() function to generate a vector of TRUE/FALSE values for missing or not, respectively, then sum them. As with many software packages, R views TRUE as having the value 1 and FALSE as having a value of 0, so this approach gets us the number of missing values. The “!” symbol means “not” in R so !is.na() will find the number non-missing values. Here’s a function that does this:

> nvalid <- function(x) sum(!is.na(x))
> nvalid(q2)
[1] 2

So it has found that there are two valid values for q2. This nvalid() function obviously works on vectors, but we need to apply it to the rows of our data frame. We can select the first three variables using df[1:3] and then pass the result into as.matrix() to make the rows easily accessible by R’s apply() function. The apply() function’s second argument is 1 indicating that we would like to compute the mean across rows (the value 2 would indicate columns). The final arguments are the functions to apply and any arguments they need.

> means  <- apply(as.matrix(df[1:3]), 1, mean, na.rm = TRUE)
> counts <- apply(as.matrix(df[1:3]), 1, nvalid)
> means
[1] 2.0 1.5 1.0
> counts
[1] 3 2 1

We have our means and the counts of valid values, so all that remains is to choose our desired value of counts and accept the mean if the data have that value or greater, but return a missing value (NA) if not. This can be done using the ifelse() function, whose first argument is the logical condition, followed by the value desired when TRUE, then the value when false.

> means <- ifelse(counts >= 2, means, NA)
> means
[1] 2.0 1.5 NA

We’ve seen all the parts work, so all that remains is to put them together into a single function that has two arguments, one for the data frame and one for the n required.

mean.n   <- function(df, n) {
  means <- apply(as.matrix(df), 1, mean, na.rm = TRUE)
  nvalid <- apply(as.matrix(df), 1, function(df) sum(!is.na(df)))
  ifelse(nvalid >= n, means, NA)
}

Let’s test our function requiring 1, 2 and 3 valid values.

> df$mean1 <- mean.n(df[1:3], 1)
> df$mean2 <- mean.n(df[1:3], 2)
> df$mean3 <- mean.n(df[1:3], 3)
> df
q1 q2  q3 mean1 mean2 mean3
1 1 2   3   2.0   2.0     2
2 1 2  NA   1.5   1.5    NA
3 1 NA NA   1.0   NA     NA

That looks good. You could apply this same idea to various other R functions such as sd() or var(). You could also apply it to sum() as SPSS does, but I rarely do that. If you were creating a scale score from a set of survey Likert items measuring agreement and a person replied “strongly agree” (a value of 5), to only half the items but skipped the others, would you want the resulting score to be a neutral value as the sum would imply, or “strongly agree” as the mean would indicate? The mean makes much more sense in most situations. Be careful though as there are standardized tests that require use of the sum.

If you’re an SPSS user looking to learn just enough R to use the two together, you might want to read this, or to learn more you could take one of my workshops. If you really want to dive into the details, you might consider reading my book, R for SAS and SPSS Users.

R Workshops Updated to Include the Latest Packages

Two new R packages are quickly becoming standards in the R community:
Hadley Wickham’s dplyr and tidyr. The dplyr package almost completely replaces his popular plyr package for data manipulation. Most importantly for general R use, it makes it much easier to select variables.  For example,

R workshop series presented at a major pharmaceutical company.
R workshop series presented at a major pharmaceutical company. Photography by Stephen Bernard.

if your data included variables for race, gender, pretest, posttest, and four survey items q1 through q4, you could select various sets of variables using:

library("dplyr")
select(mydata, race, gender) # Just those two variables.
select(mydata, gender:posttest)   # From gender through posttest.
select(mydata, contains("test"))  # Gets pretest & posttest.
select(mydata, starts_with("q"))  # Gets all vars staring with "q".
select(mydata, ends_with("test")) # All vars ending with "test".
select(mydata, num_range("q", 1:4)) # q1 thru q4 regardless of location.
select(mydata, matches("^q"))  # Matches any regular expression.

As I show in my books, these were all possible in R before, but they required much more programming.

The tidyr package replaces Hadley’s popular reshape and reshape2 packages with a data reshaping approach that is simpler and more focused just on the reshaping process, especially converting from “wide” to “long” form and back.

I’ve integrated dplyr in to my workshop R for SAS, SPSS and Stata Users, and both tidyr and dplyr now play extensive roles in my Managing Data with R workshop. The next Virtual Instructor-led Classroom (webinar) version of those workshops I’m doing in partnership with Revolution Analytics during the week of October 6, 2014.  I’m also available to teach them at your organization’s site in partnership with RStudio.com (contact me at Muenchen.bob@gmail.com to schedule a visit). These workshops will also soon be available 24/7 at Datacamp.com. “You’ll be able to take Bob’s popular workshops using an interactive combination of video and live exercises in the comfort of your own browser” said Jonathan Cornelissen, CEO of Datacamp.com.

Knoxville R Users’ Group Meets September 3rd

The Knoxville R Users Group (KRUG) is hosting a brown bag viewing of RStudio’s webinar “Interactive Reporting” at 11am, Weds 3-Sept-2014 in 427 Hesler on the UTK campus “Hill” .  Per RStudio.net, data scientist Garrett Grolemund and software engineer Joe Cheng will speak on how to make your R Markdown documents interactive, and then unleash the full flexibility of analytic app development with shiny.  Come join us!

r4stats.com 2013 in review

The WordPress.com stats helper monkeys prepared a 2013 annual report for this blog.

Here’s an excerpt:

The Louvre Museum has 8.5 million visitors per year. This blog was viewed about 150,000 times in 2013. If it were an exhibit at the Louvre Museum, it would take about 6 days for that many people to see it.

Click here to see the complete report.